John Pauline Pineda

Part Engineer,
Part Statistician,
100% Lifelong Learner.
LinkedIn
ResearchGate
GitHub
Google Scholar
Tableau Public
Data Science Project Portfolio
Machine Learning Applications
Model Deployment : Classifying Brain Tumors from Magnetic Resonance Images by Leveraging Convolutional Neural Network-Based Multilevel Feature Extraction and Hierarchical Representation
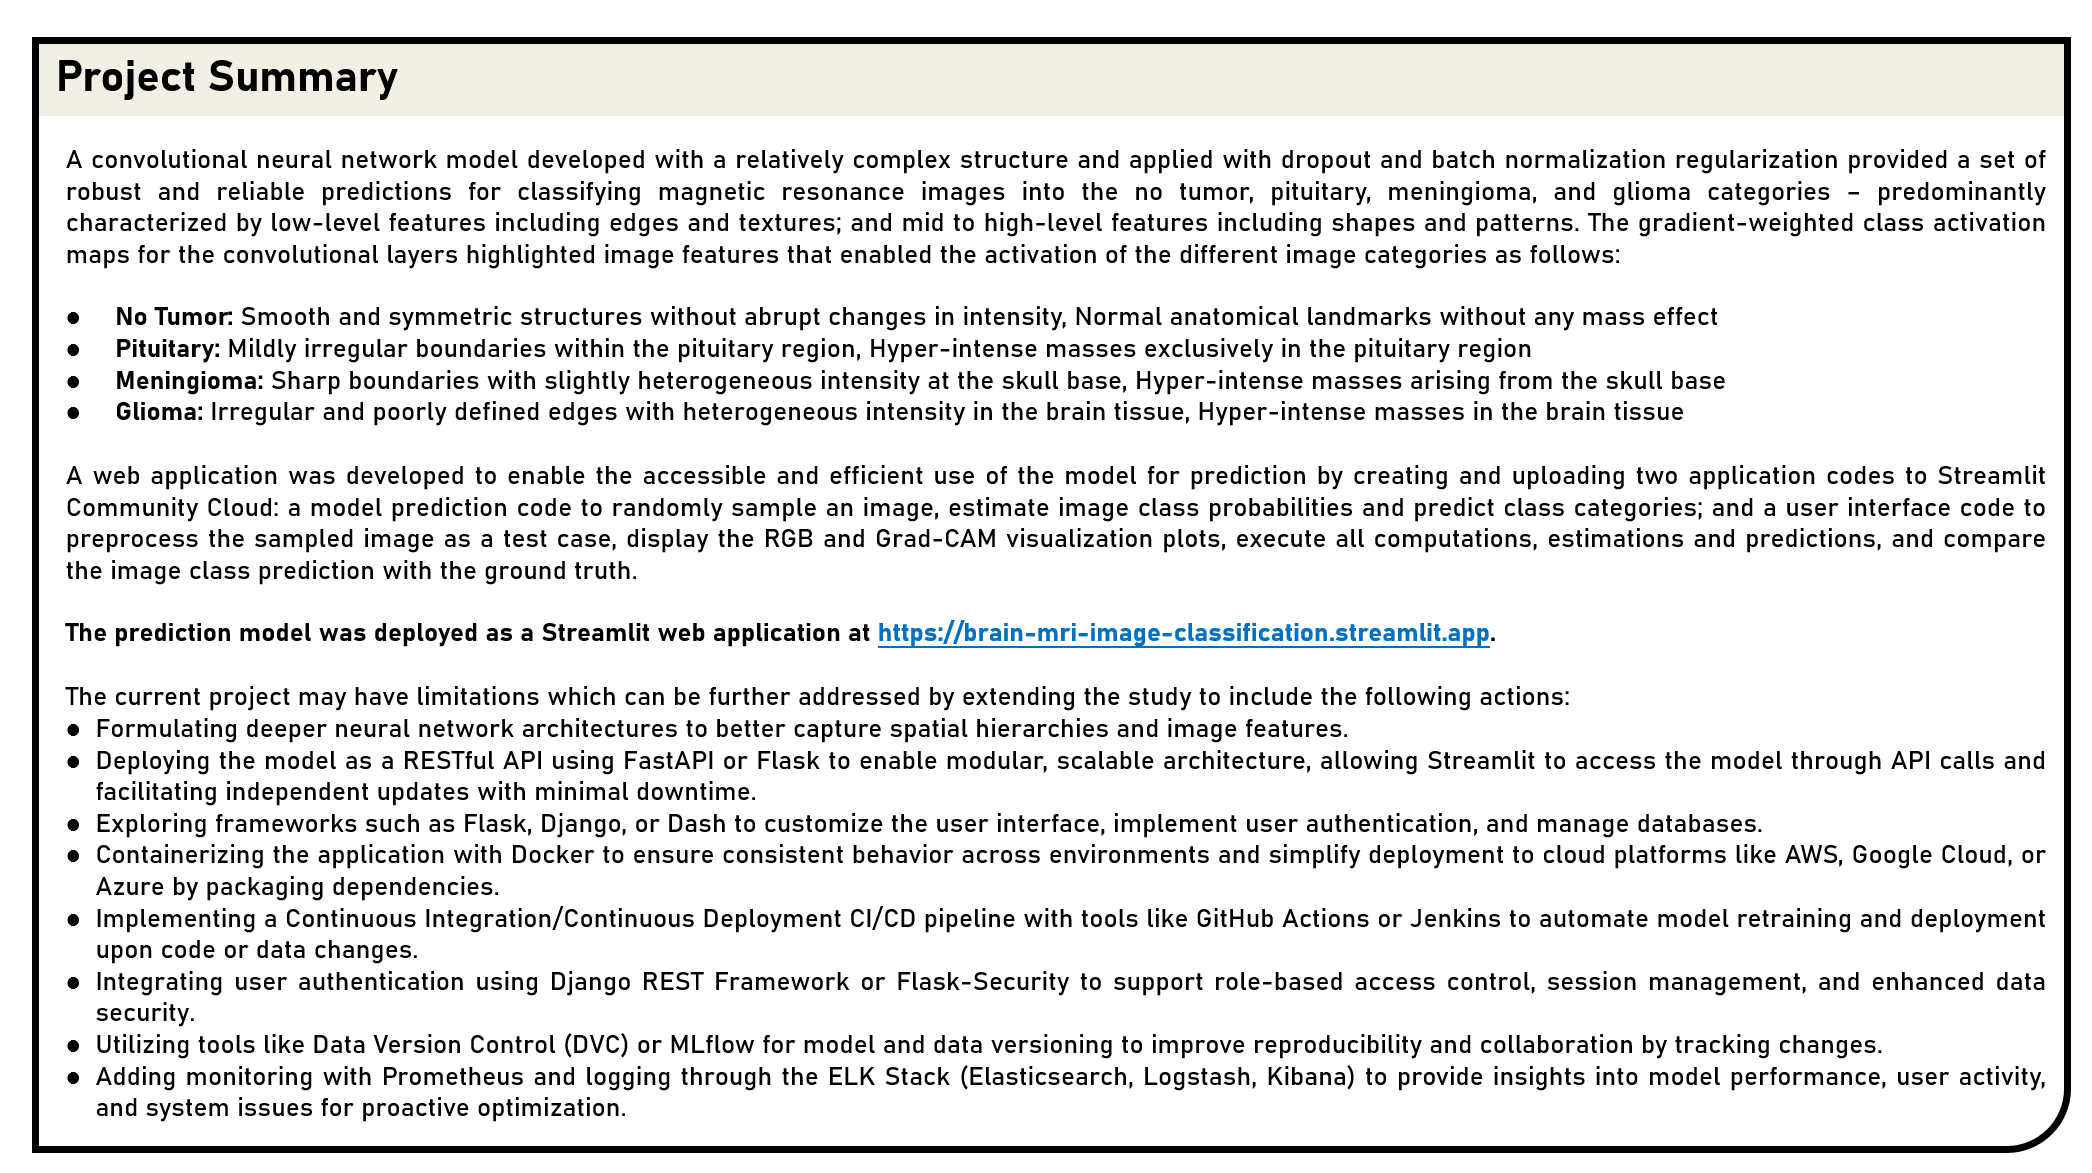
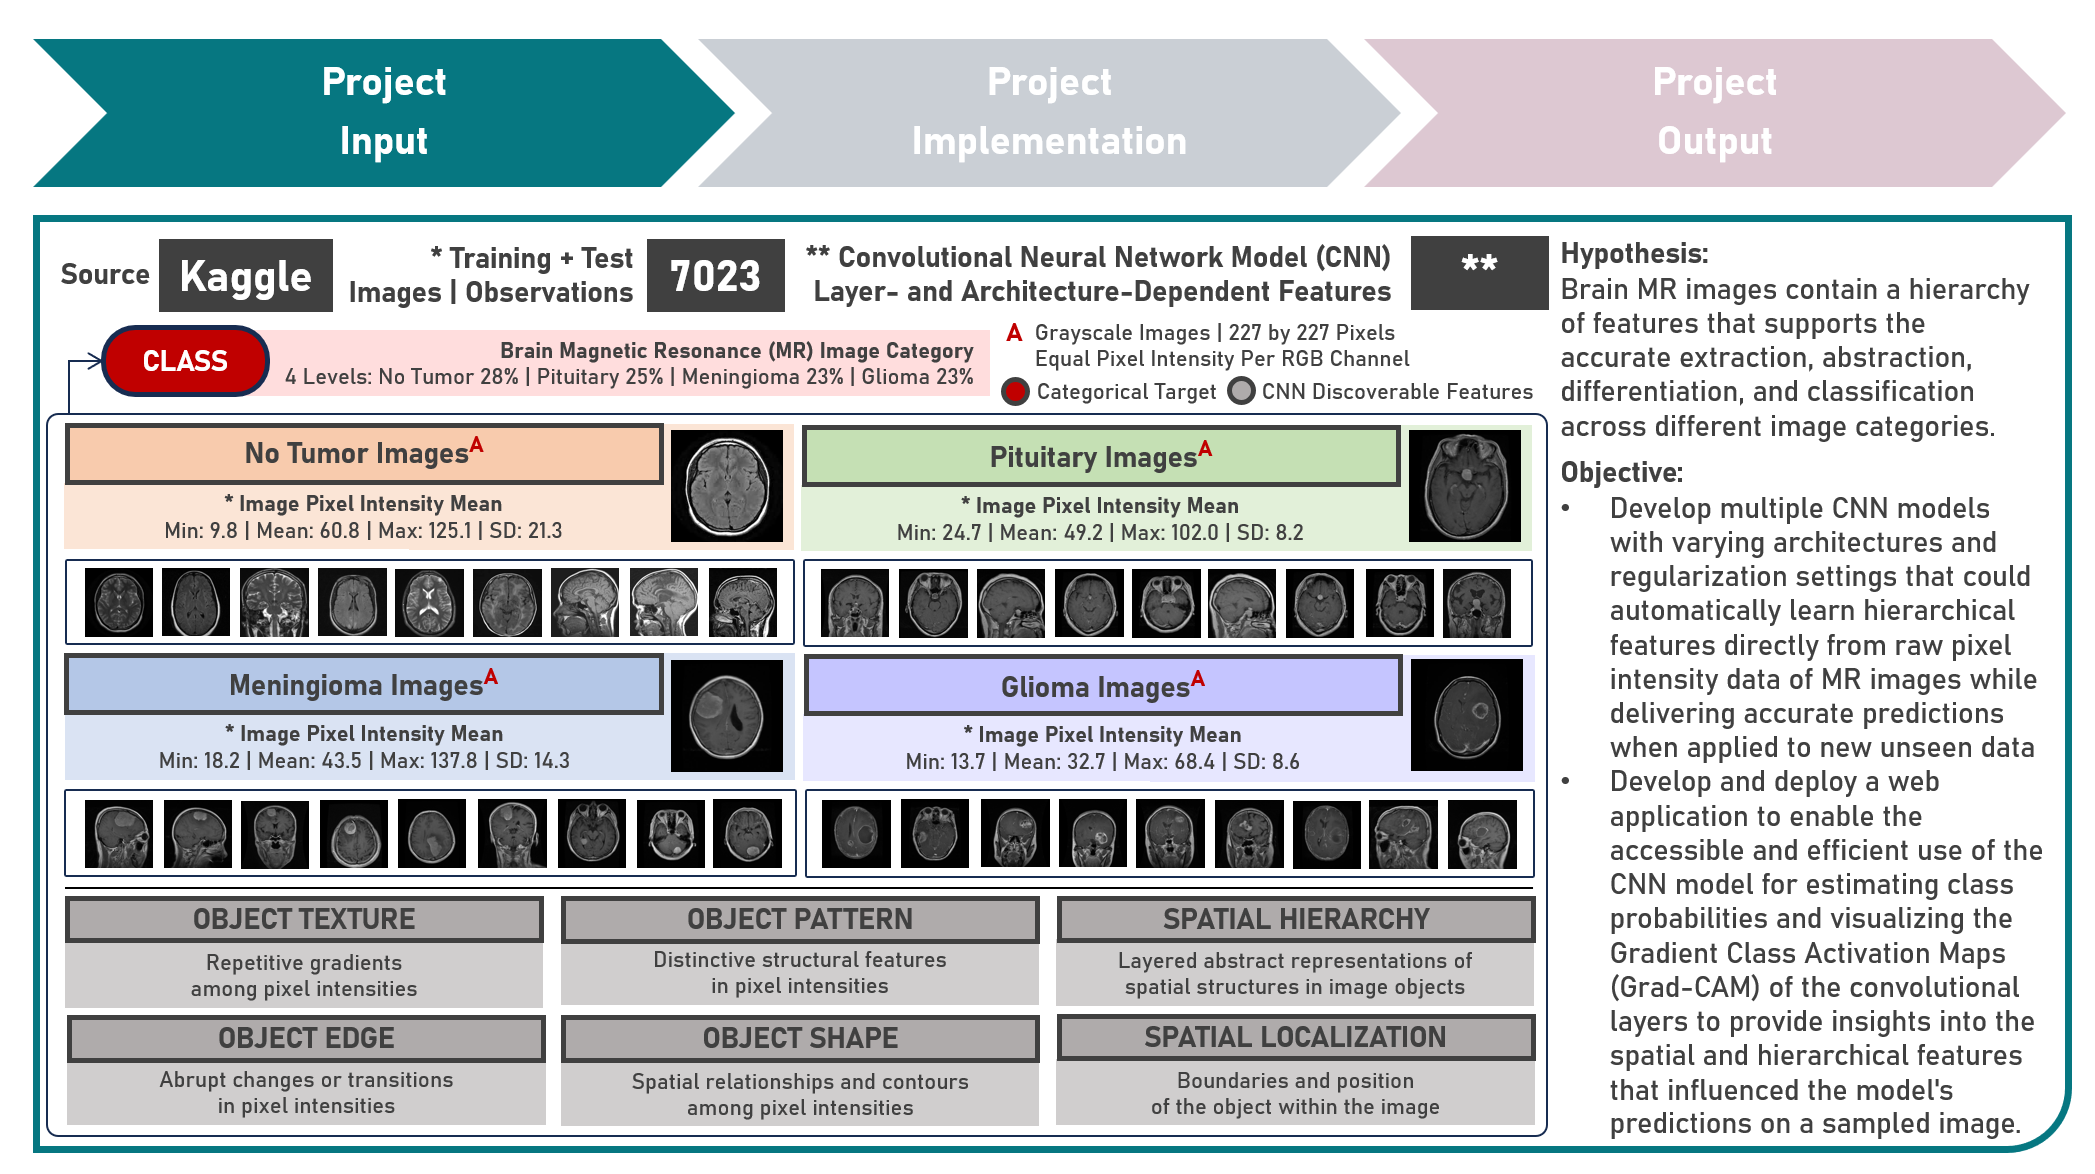
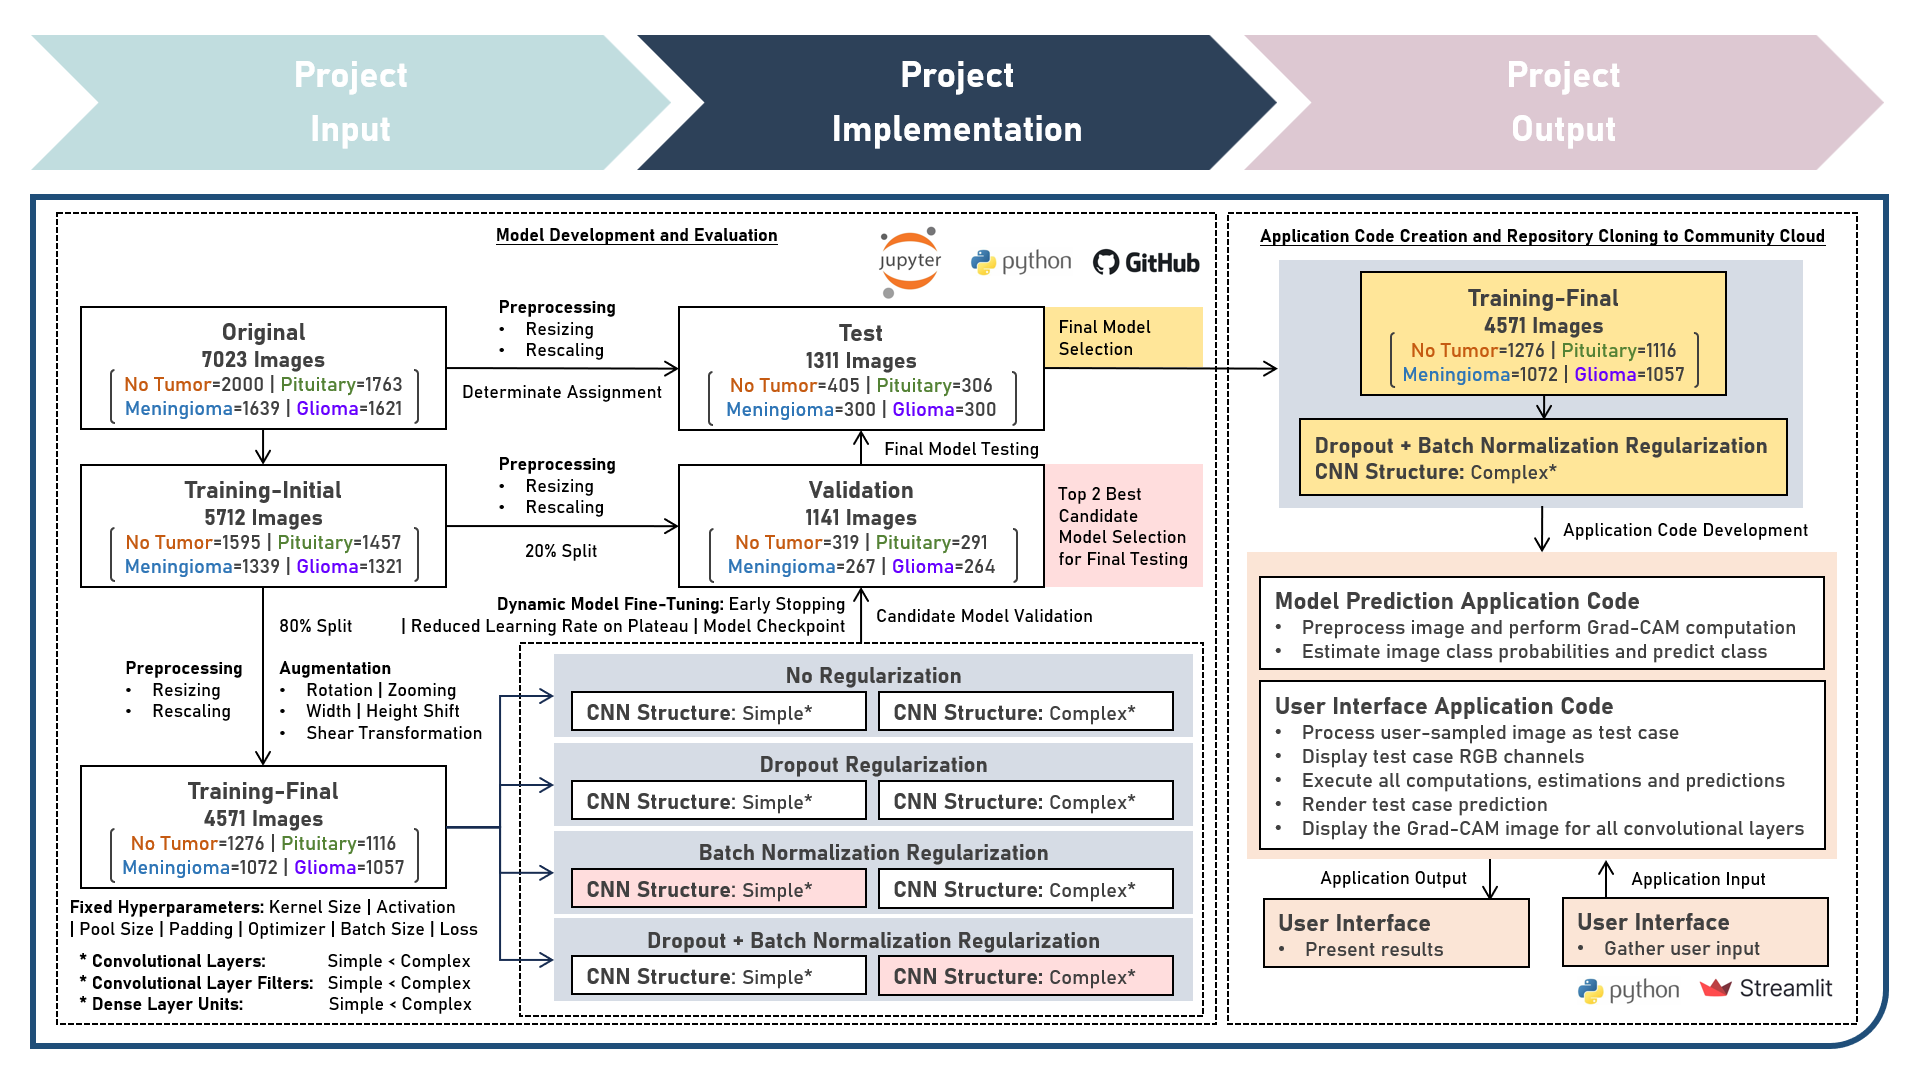
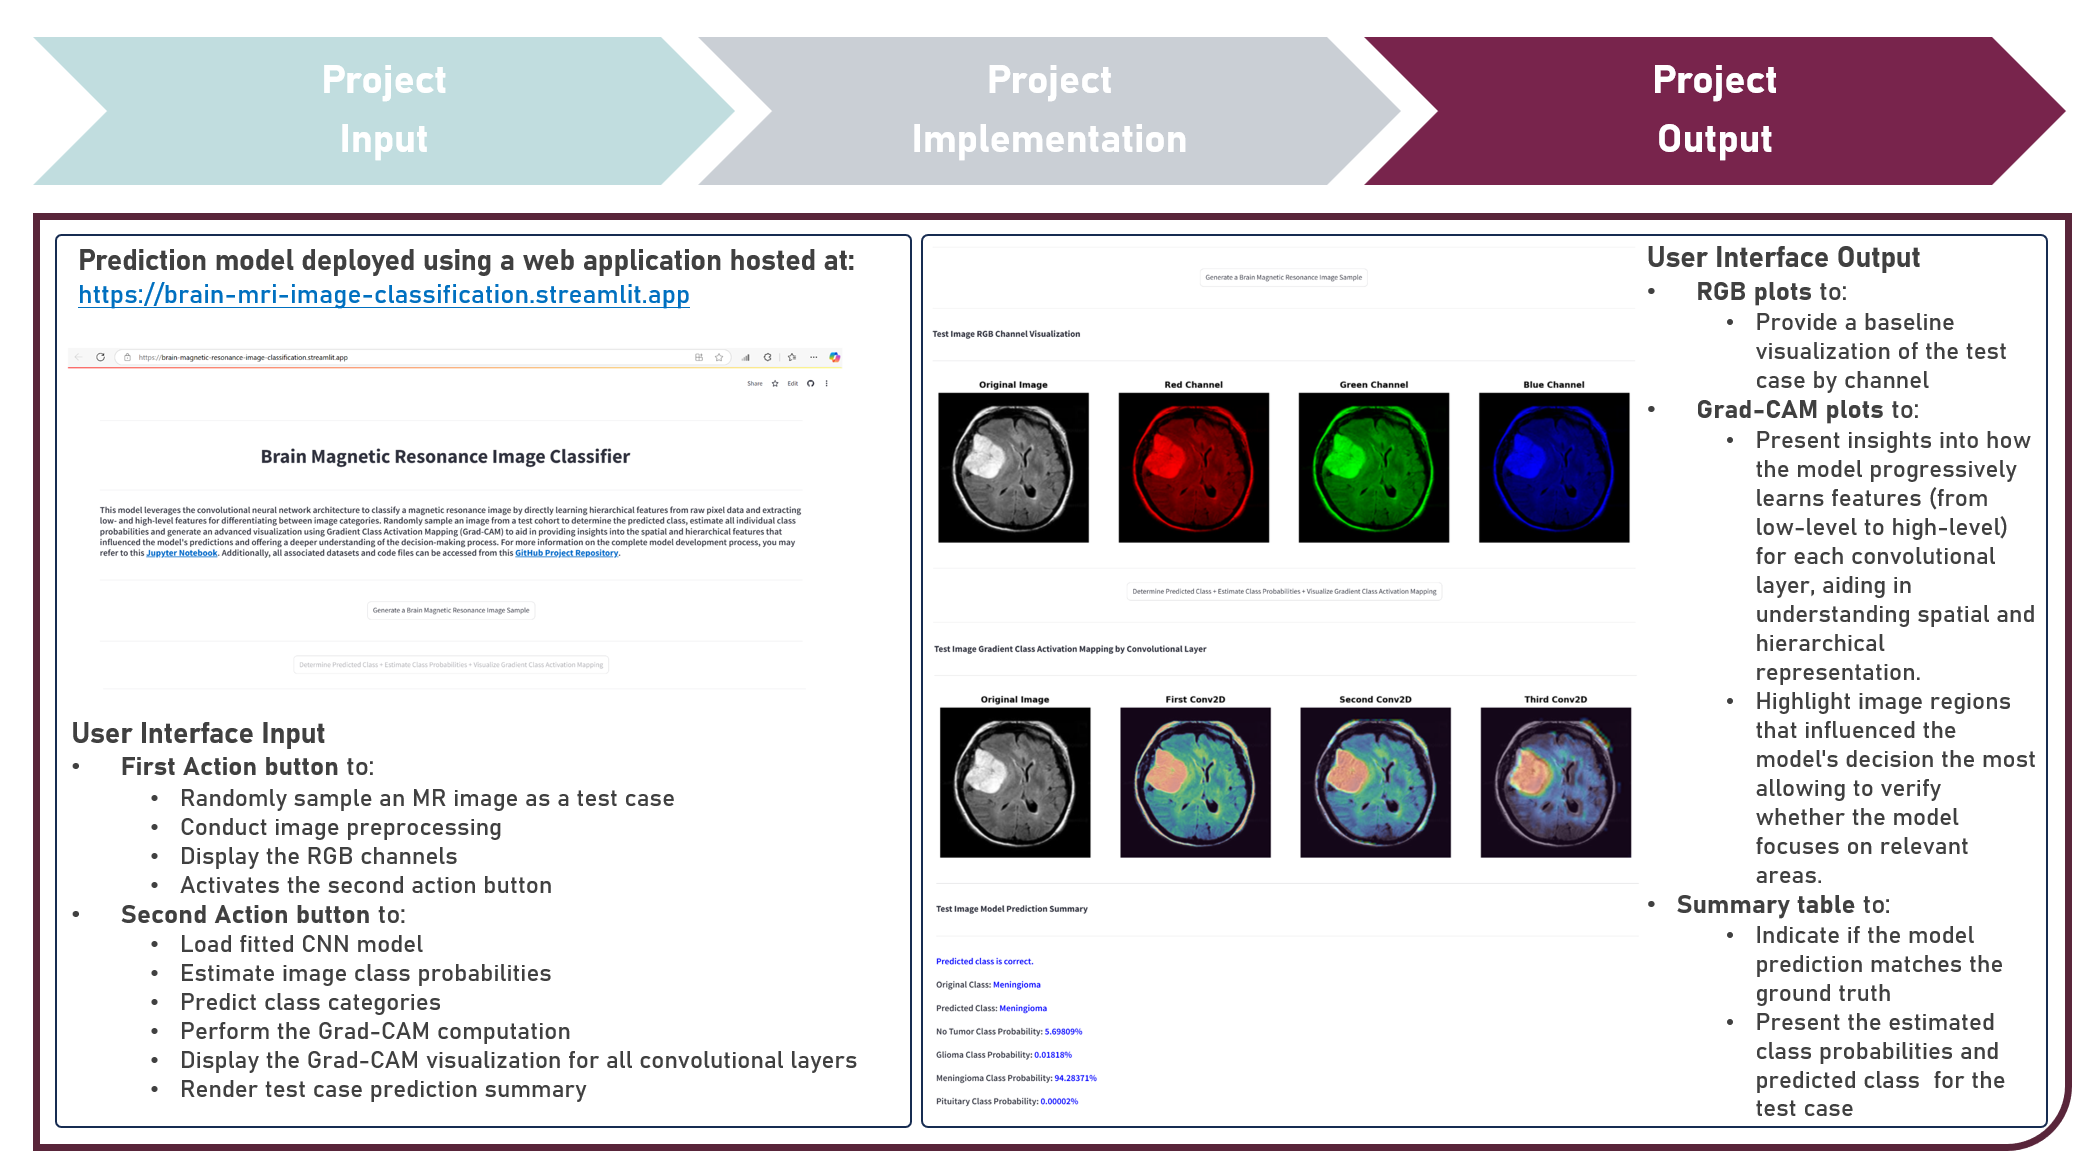
This project aims to develop a web application to enable the accessible and efficient use of an image classification model for directly learning hierarchical features from raw pixel data of brain magnetic resonance images. The model development process leveraged the Convolutional Neural Network to extract low- and high-level features for differentiating between image categories. Various hyperparameters, including the number of convolutional layers, filter size, and number of dense layer weights, were systematically evaluated to optimize the CNN model architecture. Image Augmentation techniques were employed to increase the diversity of training images and improve the model’s ability to generalize. To enhance model performance and robustness, various regularization techniques were explored, including Dropout, Batch Normalization, and their Combinations. These methods helped mitigate overfitting and ensured stable learning. Callback functions such as Early Stopping, Learning Rate Reduction on Performance Plateaus, and Model Checkpointing were implemented to fine-tune the training process, optimize convergence, and prevent overtraining. Model evaluation was conducted using Precision, Recall, and F1 Score metrics to ensure both false positives and false negatives are considered, providing a more balanced view of model classification performance. Post-training, interpretability was emphasized through an advanced visualization technique using Gradient Class Activation Mapping (Grad-CAM), providing insights into the spatial and hierarchical features that influenced the model’s predictions, offering a deeper understanding of the decision-making process. Creating the prototype required cloning the repository containing two application codes and uploading to Streamlit Community Cloud - a Model Prediction Code to randomly sample an image; estimate image class probabilities; and predict class categories, and a User Interface Code to preprocess the sampled image as a test case; display the RGB and Grad-CAM visualization plots; execute all computations, estimations and predictions; and compare the class prediction with the ground truth. The final image classification model was deployed as a Streamlit Web Application.
Model Deployment : Estimating Heart Failure Survival Risk Profiles From Cardiovascular, Hematologic And Metabolic Markers
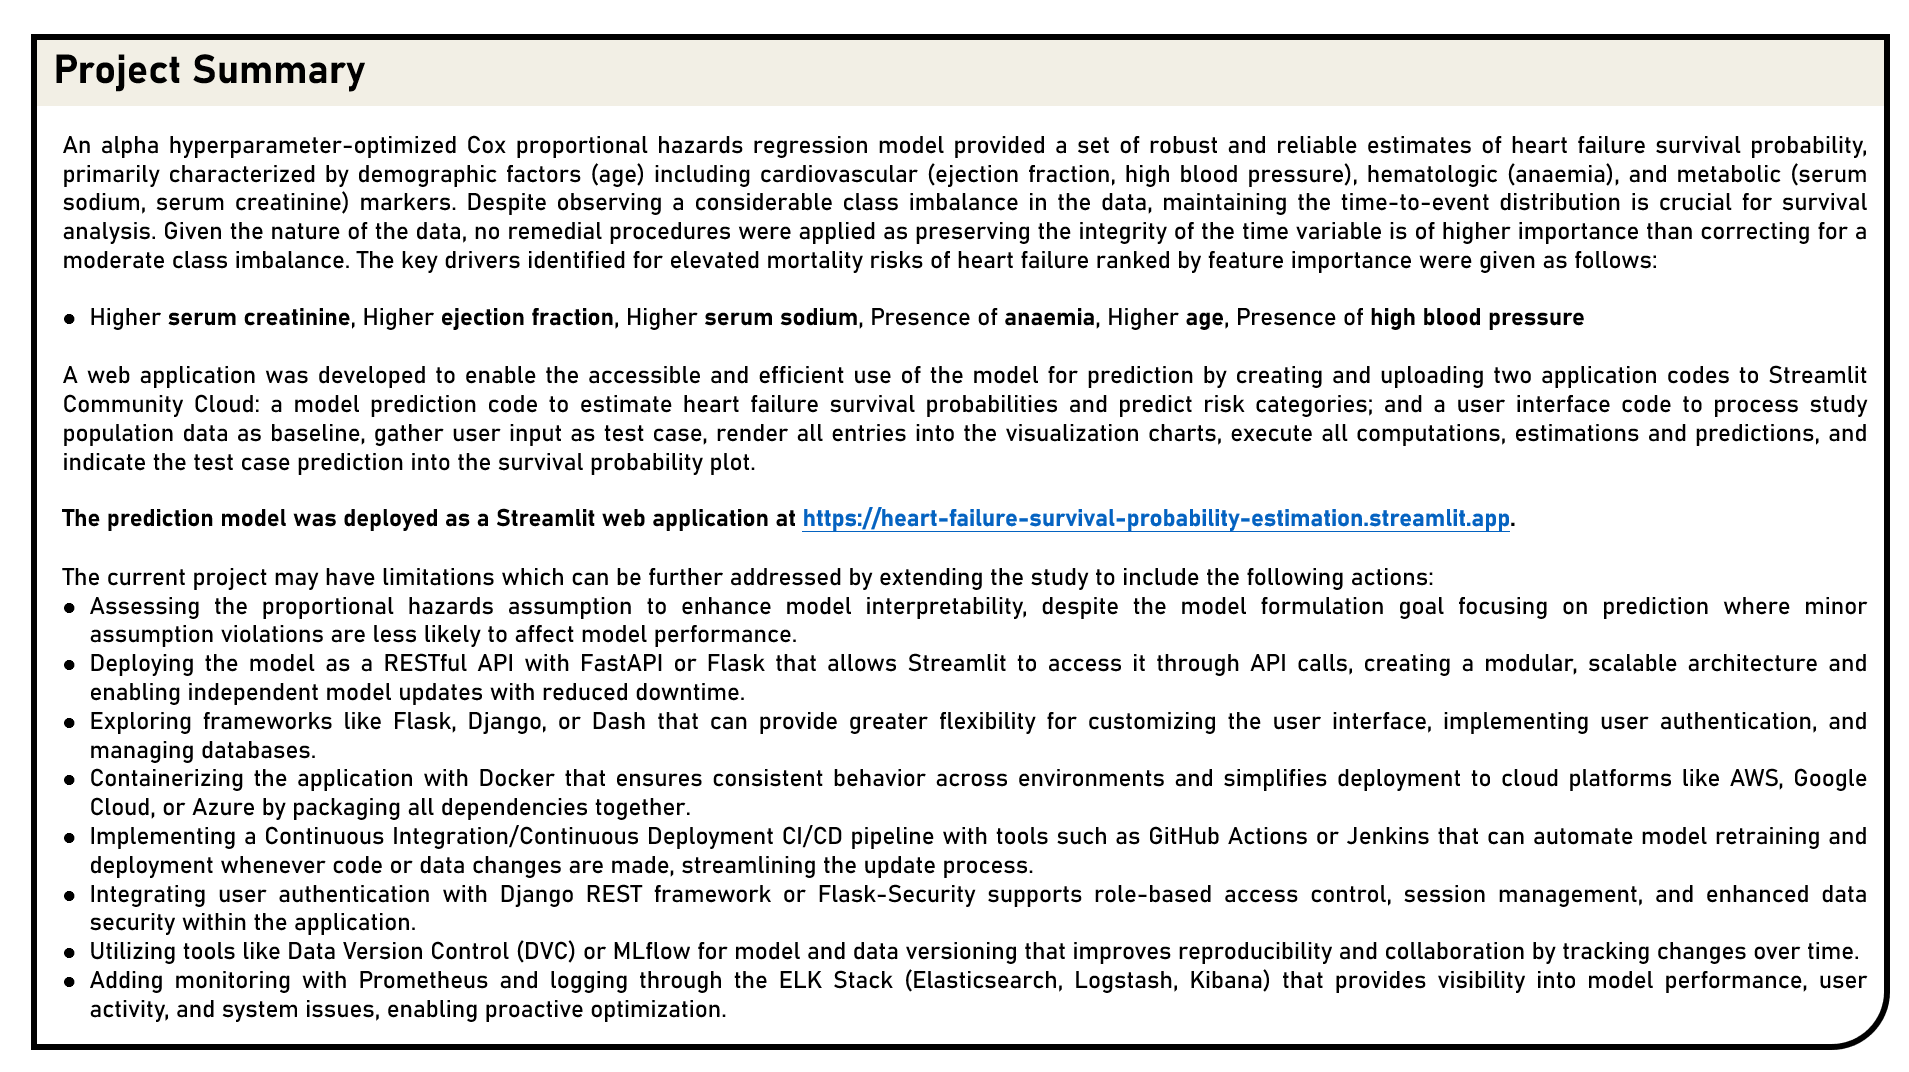
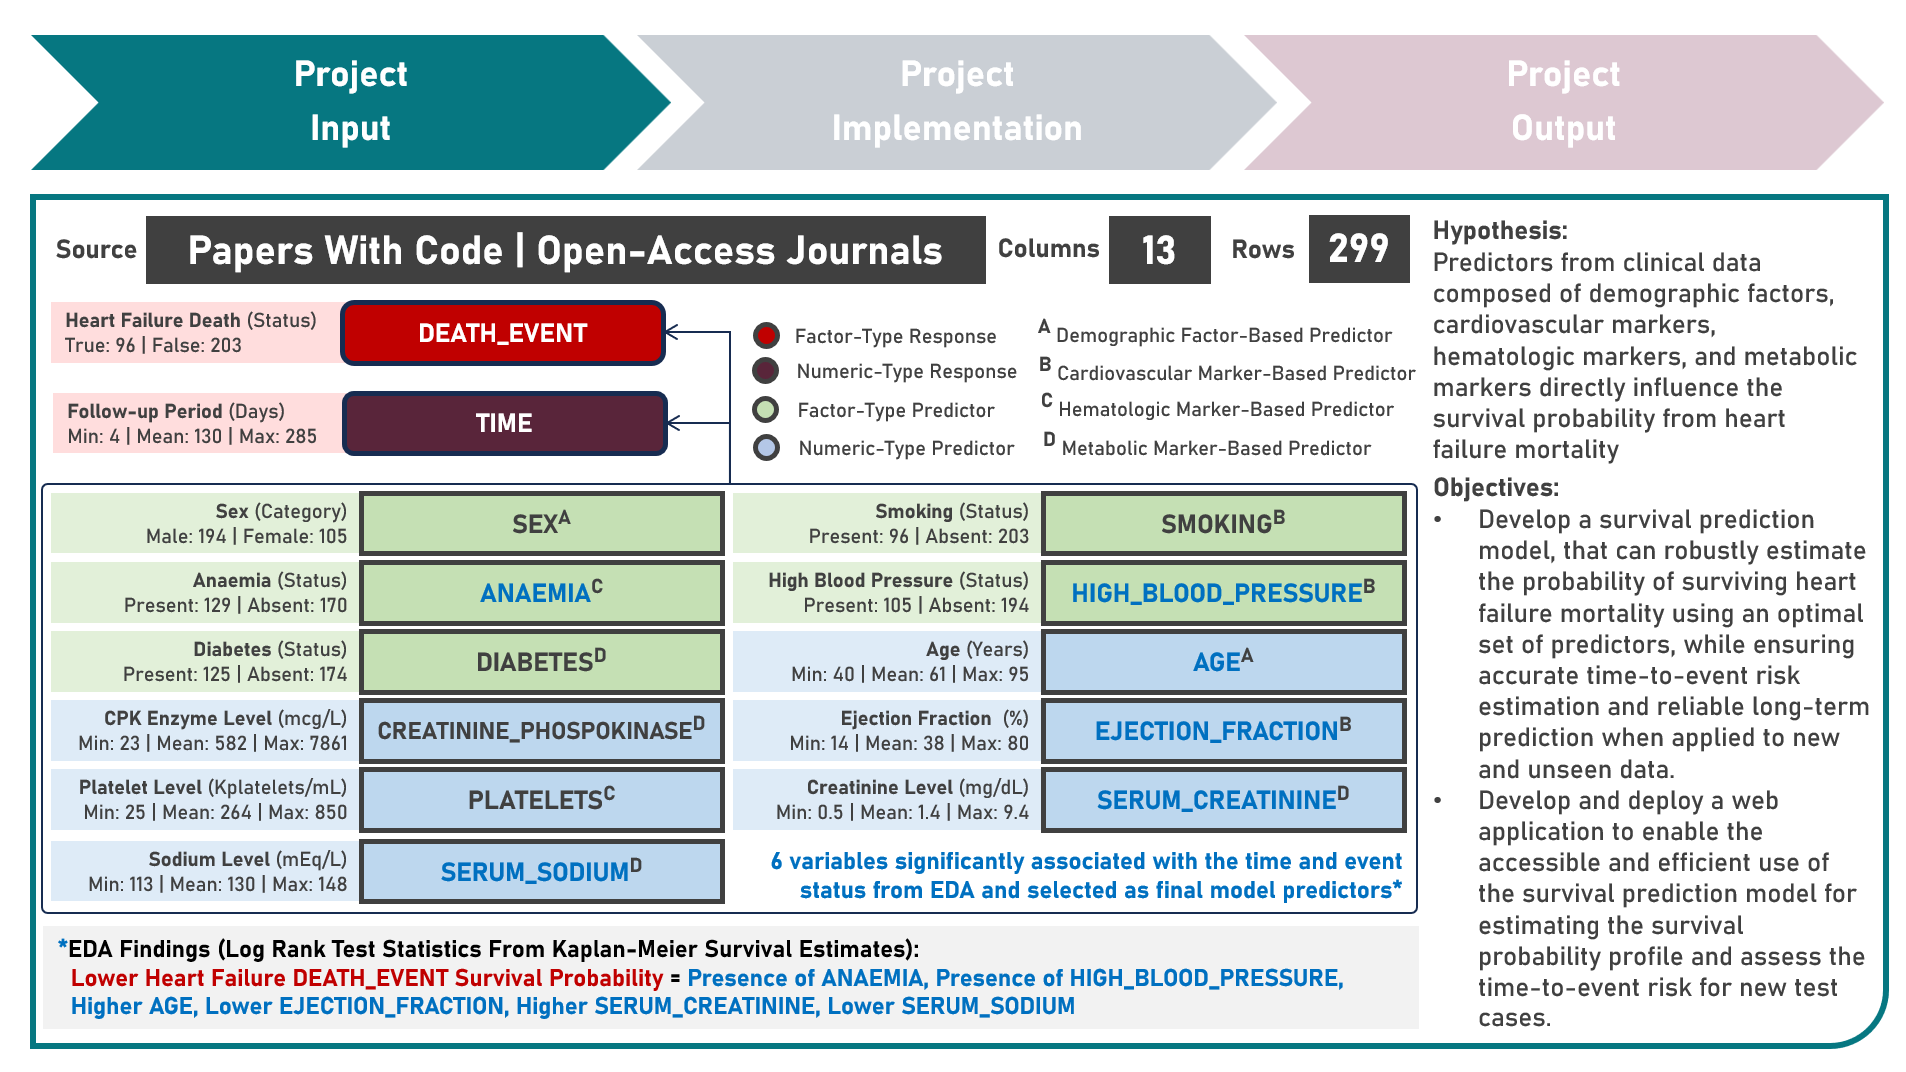
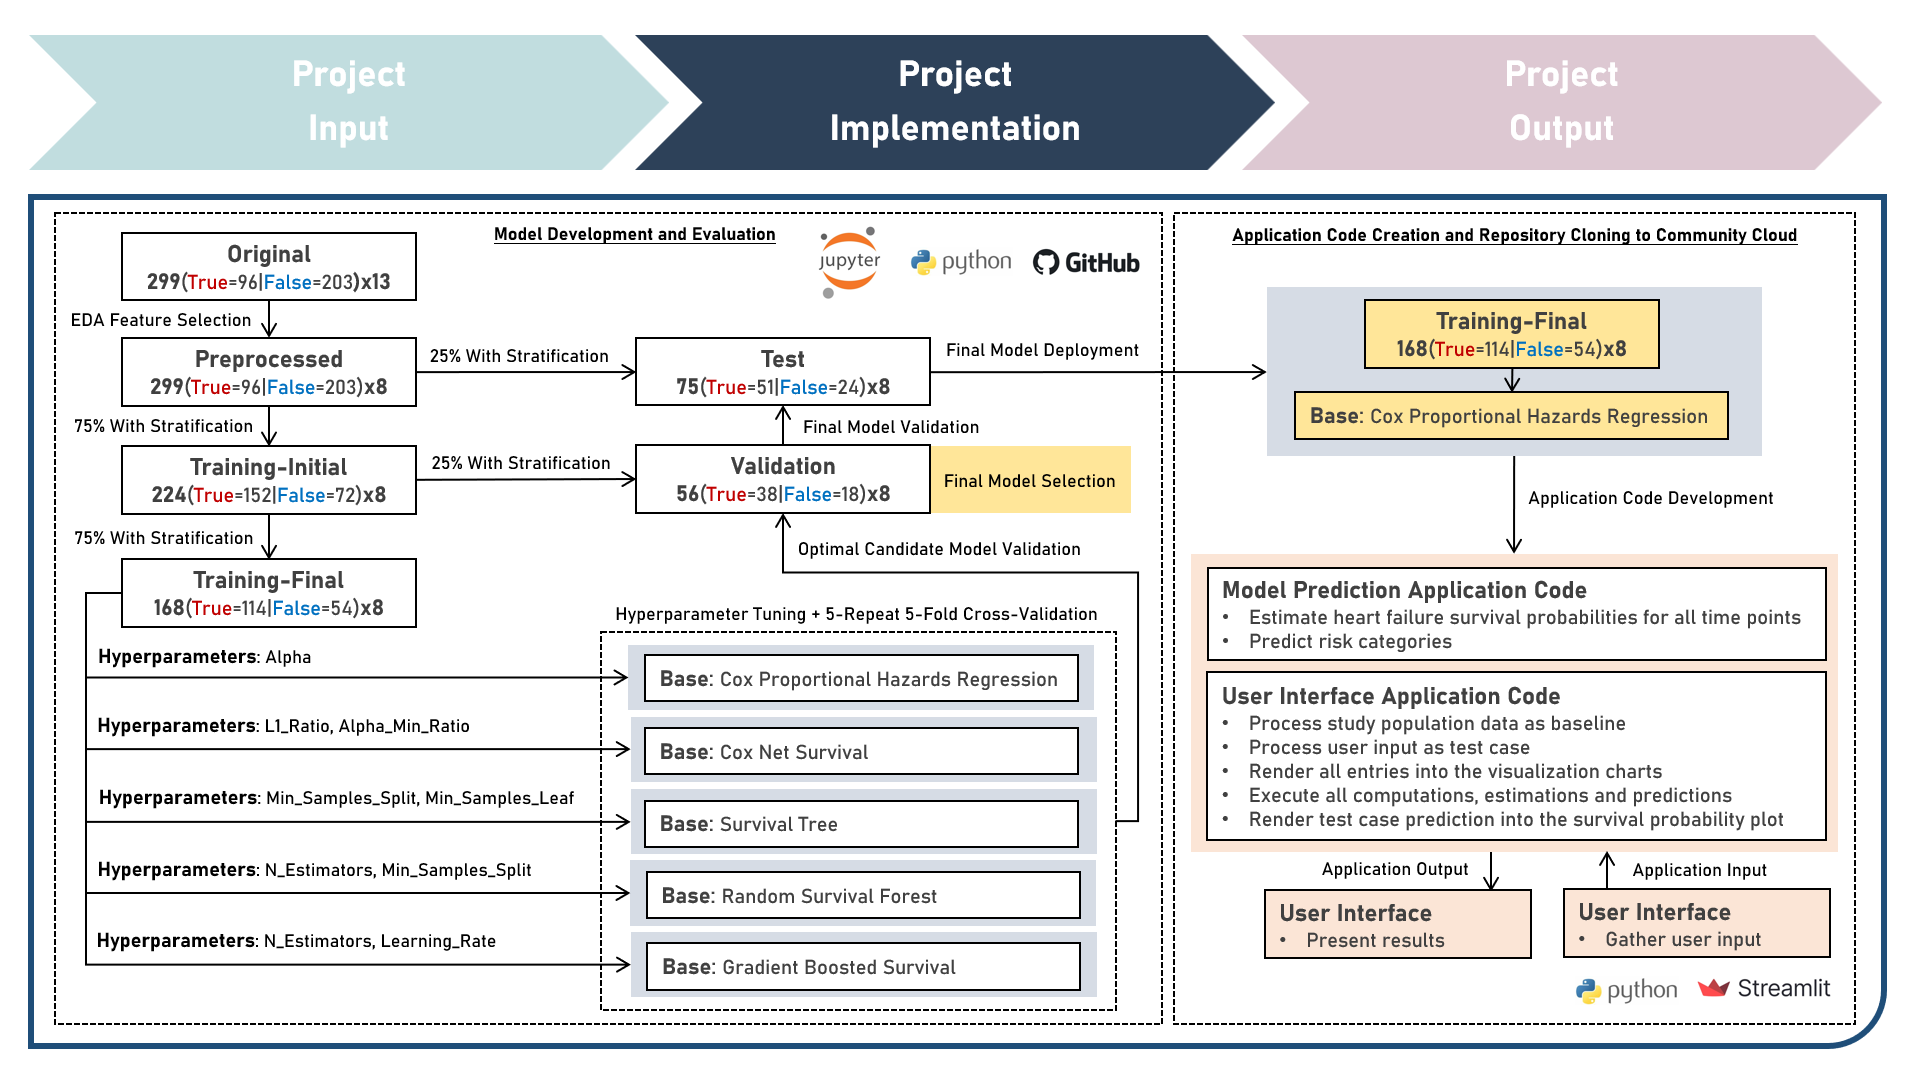
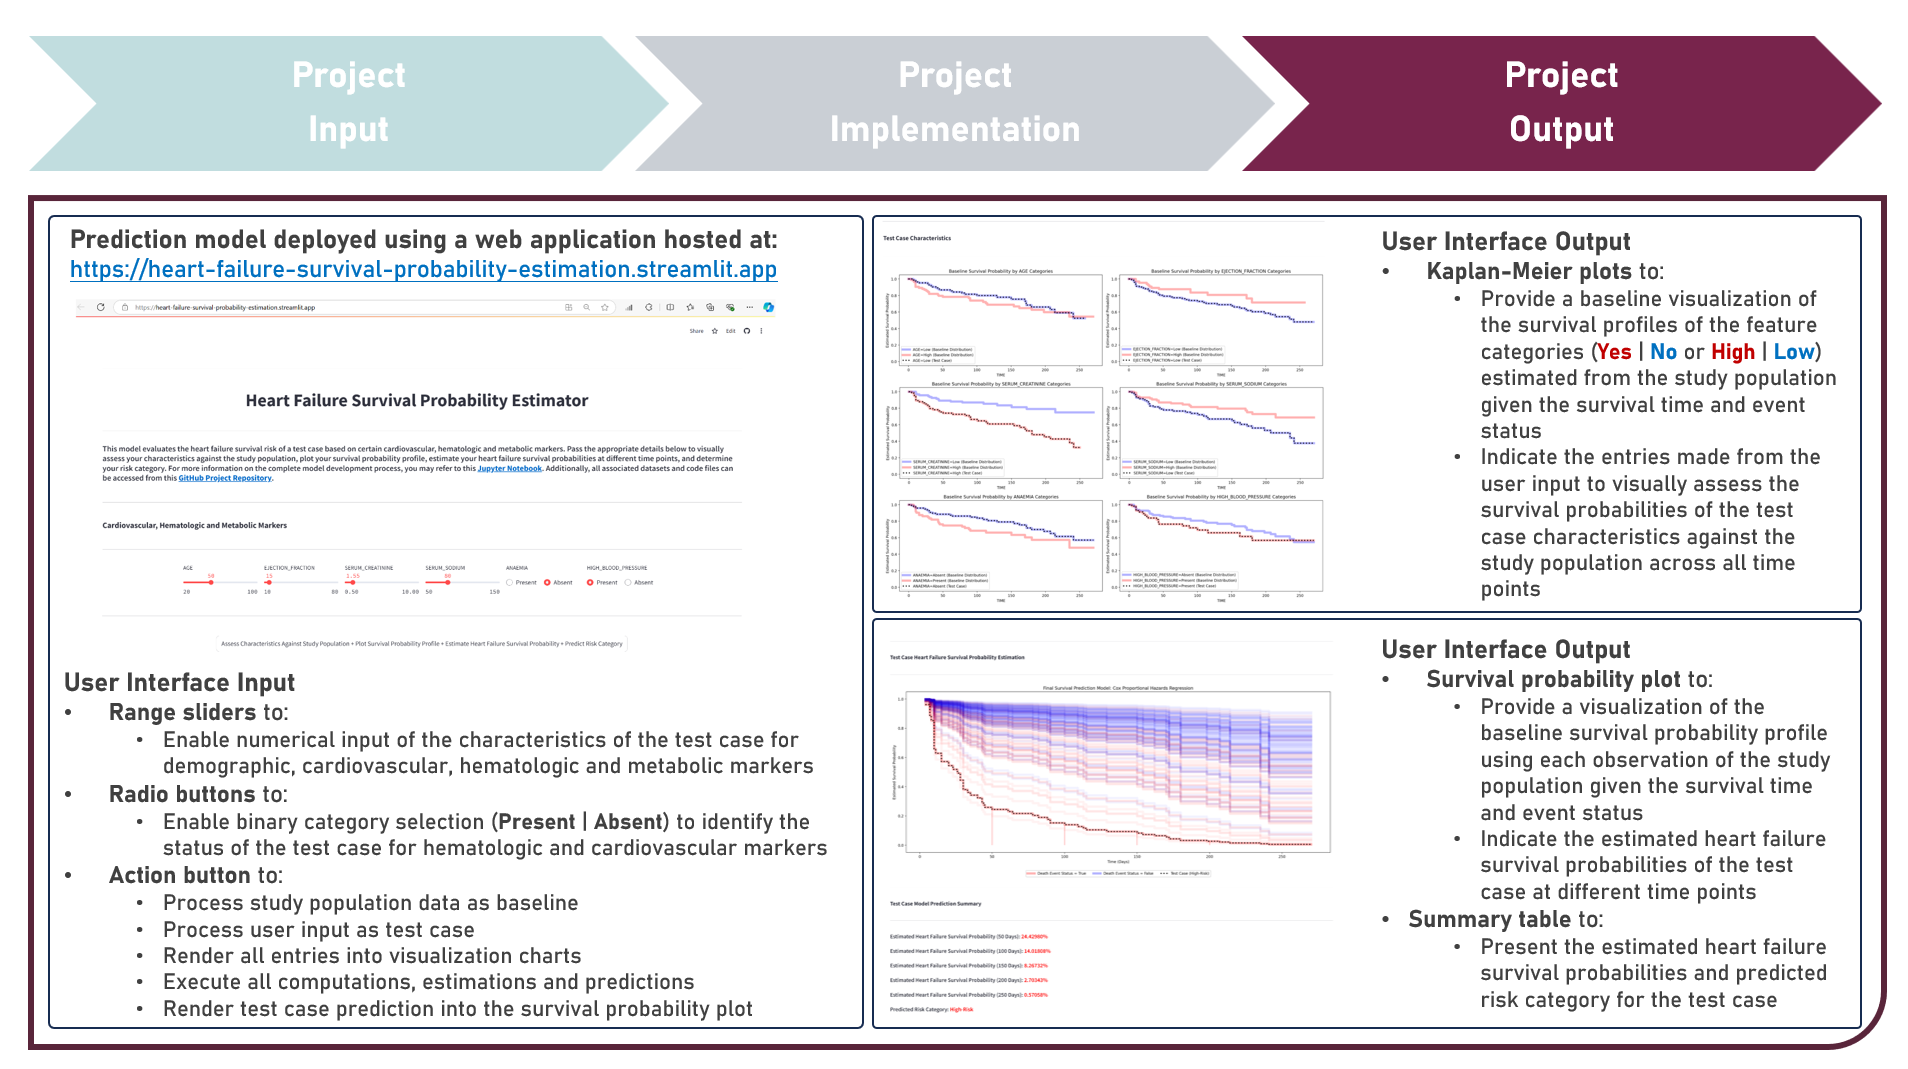
This project aims to develop a web application to enable the accessible and efficient use of a survival prediction model for estimating the heart failure survival probability and predicting the risk category of a test case, given various cardiovascular, hematologic and metabolic markers. The model development process implemented the Cox Proportional Hazards Regression, Cox Net Survival, Survival Tree, Random Survival Forest, and Gradient Boosted Survival models as independent base learners to estimate the survival probabilities of right-censored survival time and status responses, while evaluating for optimal hyperparameter combinations (using Repeated K-Fold Cross Validation), imposing constraints on model coefficient updates (using Ridge and Elastic Net Regularization, as applicable), and delivering accurate predictions when applied to new unseen data (using model performance evaluation with Harrel’s Concordance Index on Independent Validation and Test Sets). Additionally, survival probability functions were estimated for model risk-groups and the individual test case. Creating the prototype required cloning the repository containing two application codes and uploading to Streamlit Community Cloud - a Model Prediction Code to estimate heart failure survival probabilities, and predict risk categories; and a User Interface Code to process the study population data as baseline, gather the user input as test case, render all user selections into the visualization charts, execute all computations, estimations and predictions, indicate the test case prediction into the survival probability plot, and display the prediction results summary. The final heart failure survival prediction model was deployed as a Streamlit Web Application.
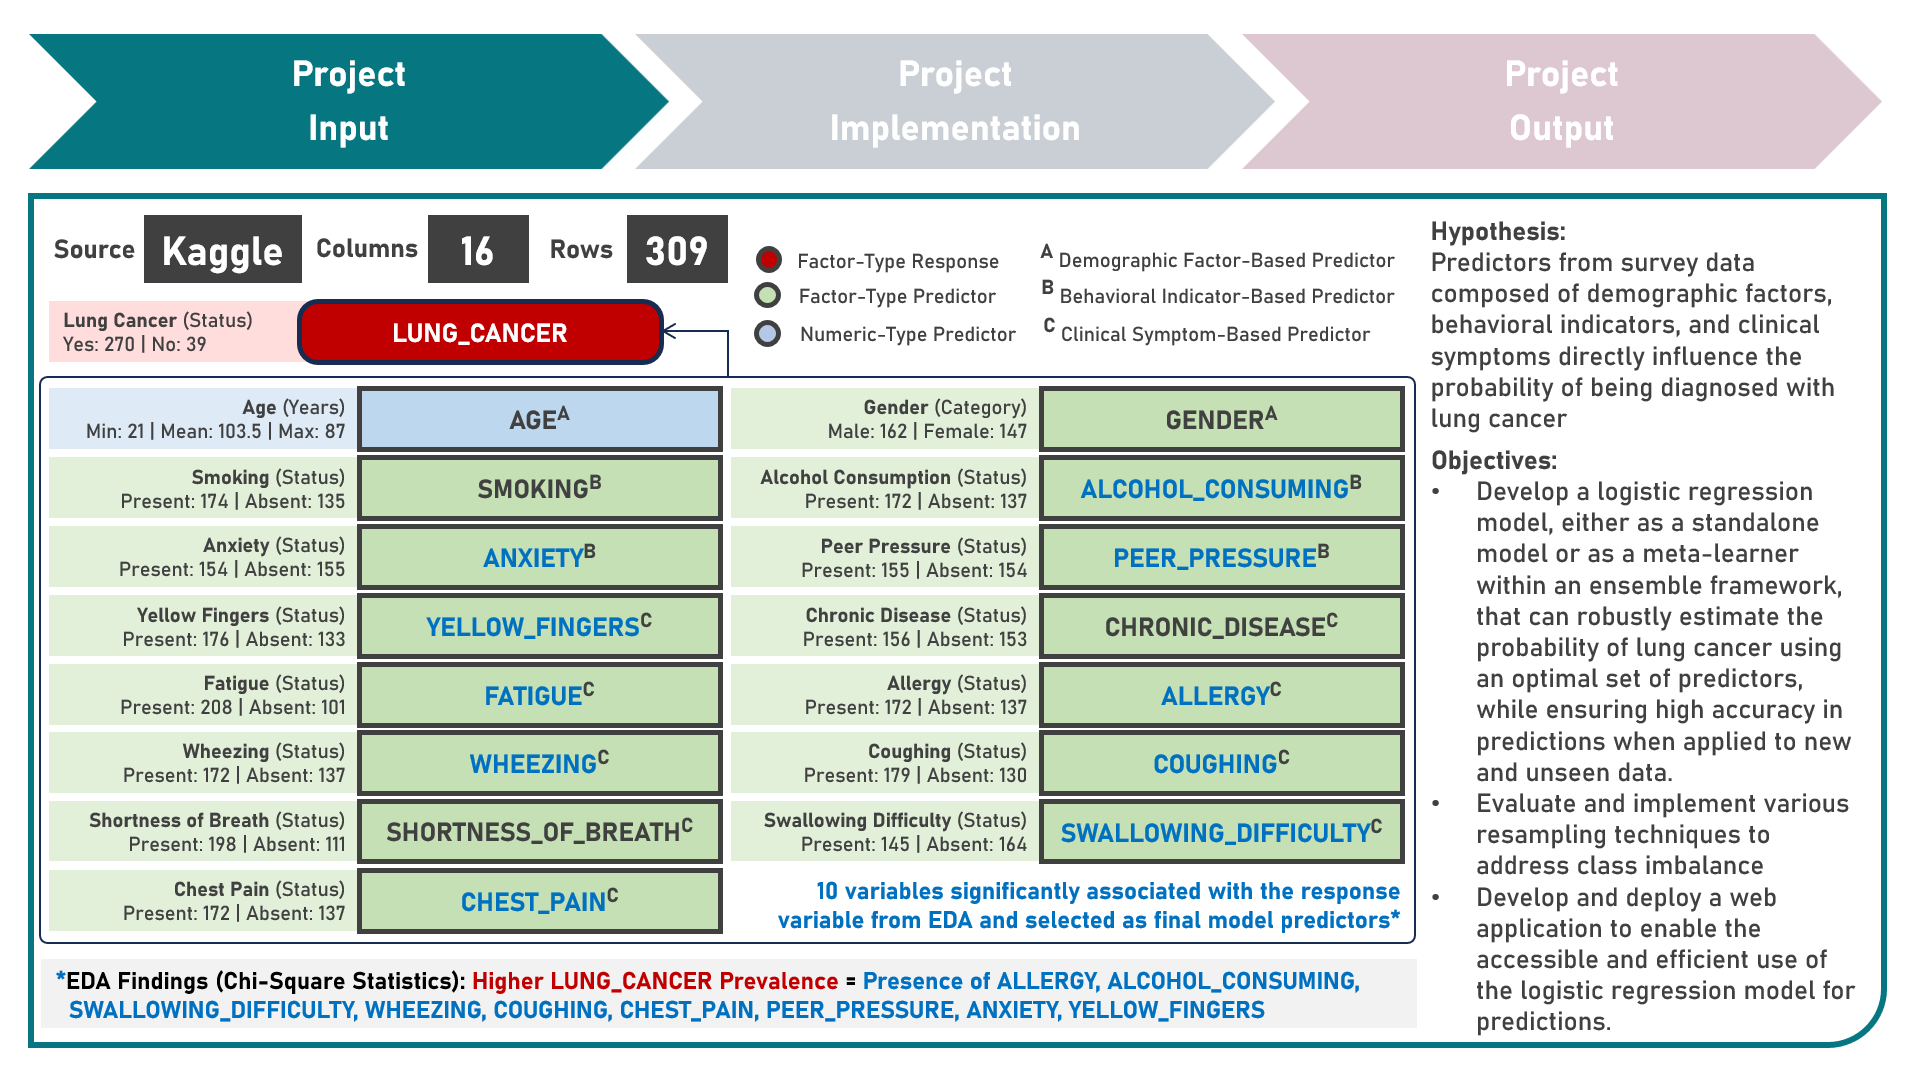
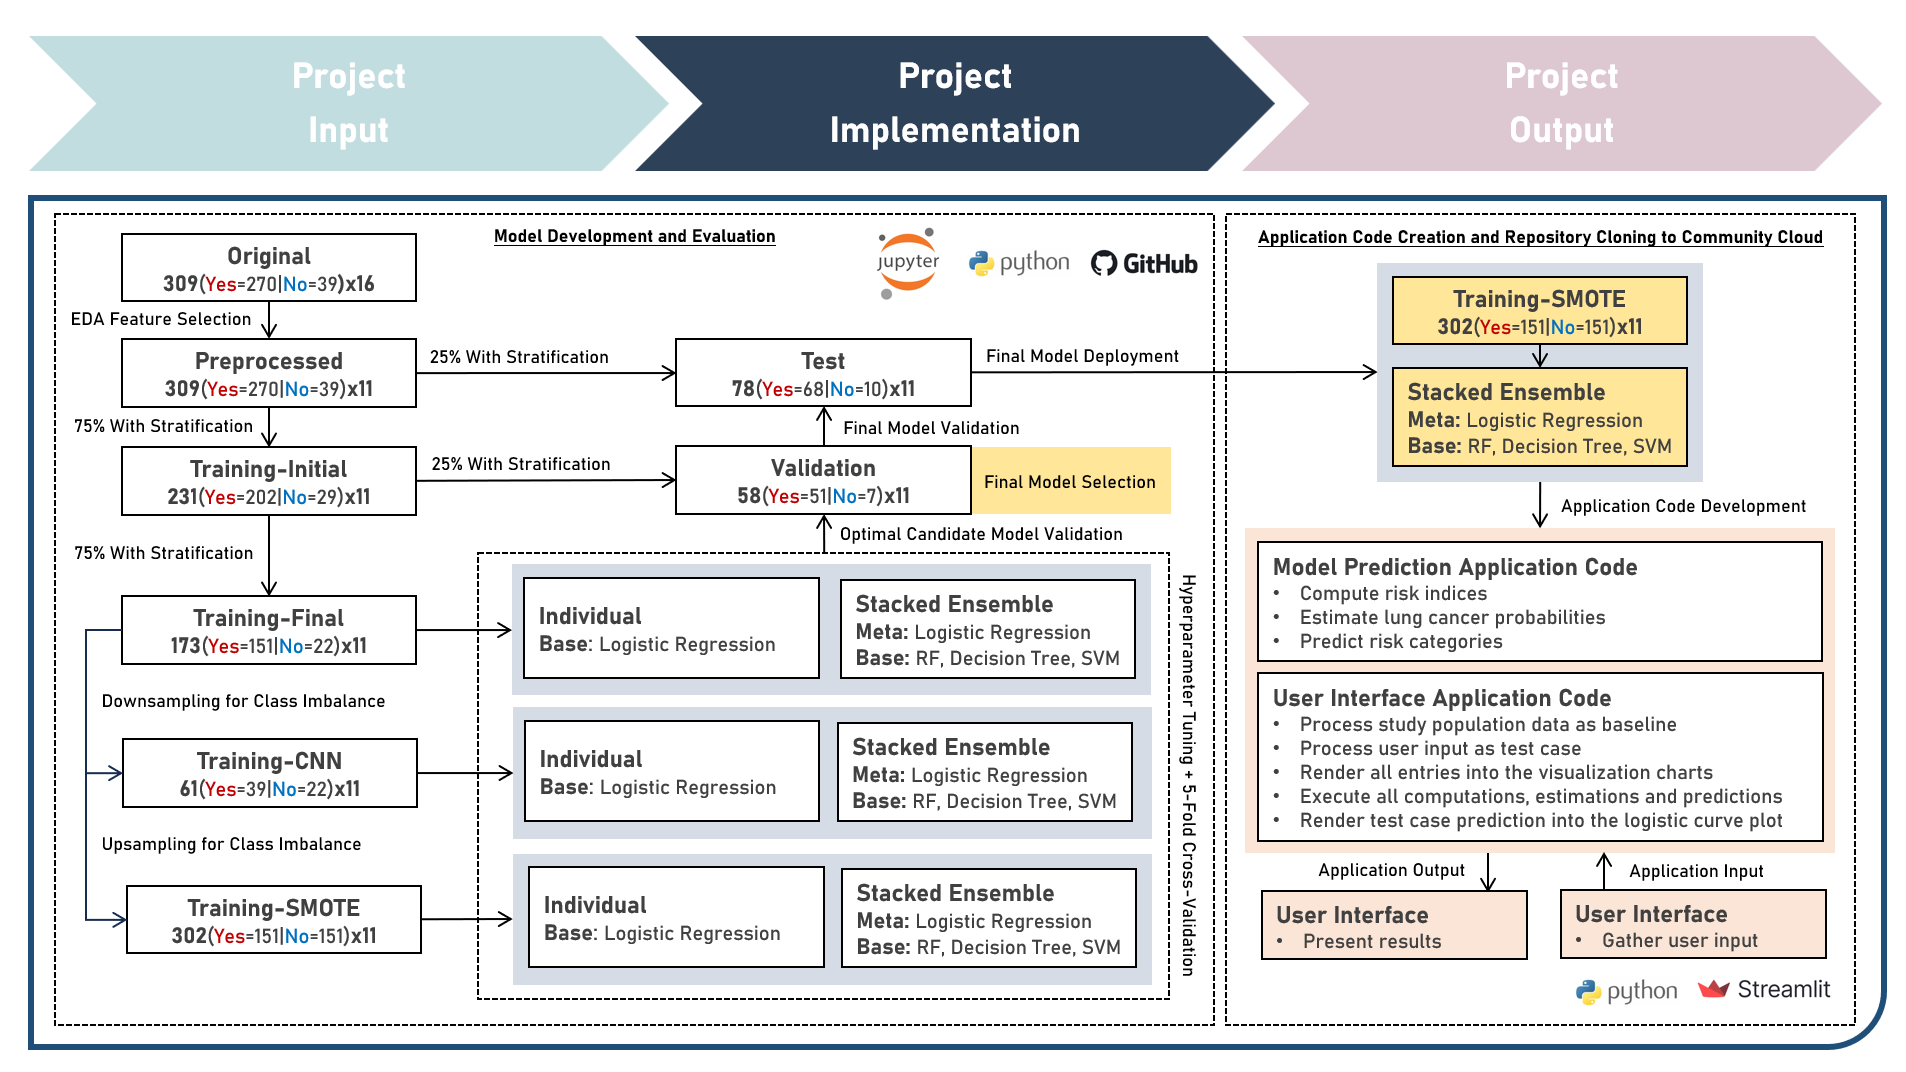
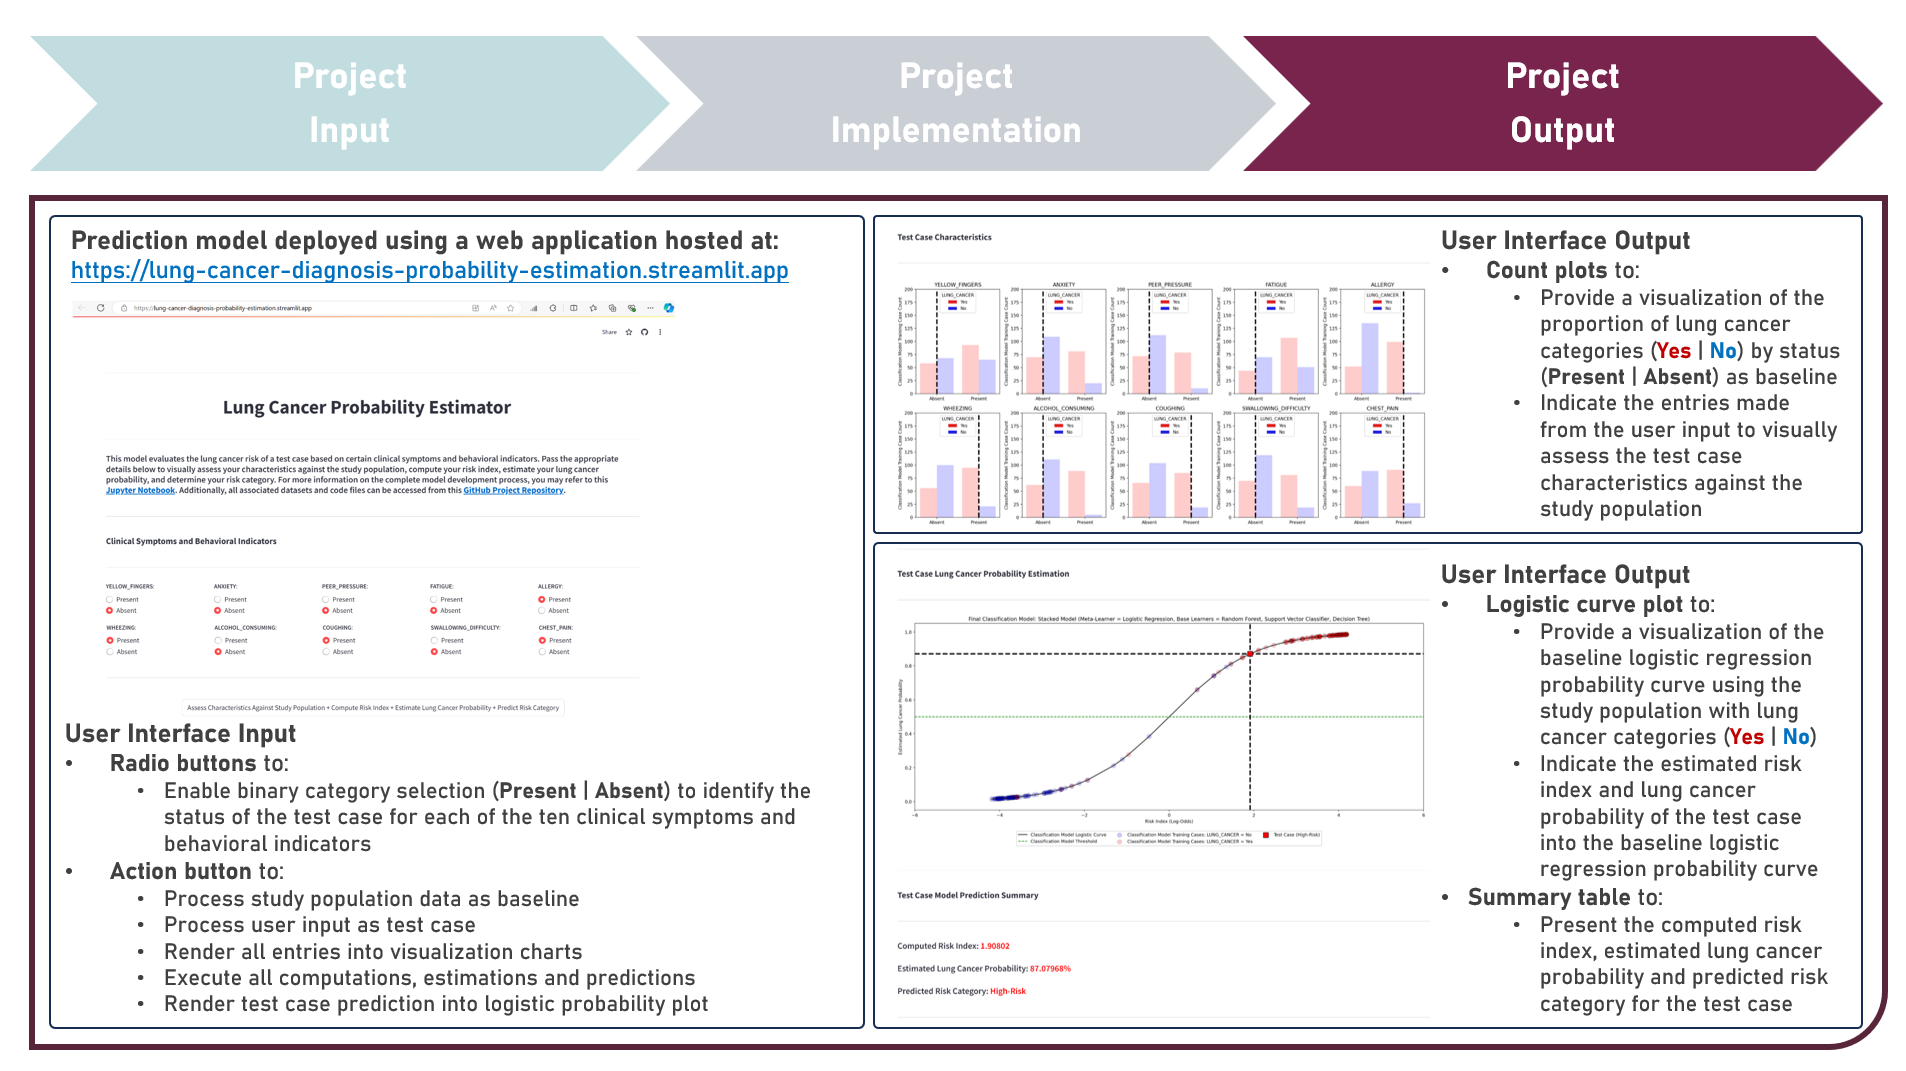
Model Deployment : Estimating Lung Cancer Probabilities From Demographic Factors, Clinical Symptoms And Behavioral Indicators
This project aims to develop a web application to enable the accessible and efficient use of a classification model for computing the risk index, estimating the lung cancer probability and predicting the risk category of a test case, given various clinical symptoms and behavioral indicators. To enable plotting of the logistic probability curve, the model development process implemented the Logistic Regression model, either as an Independent Learner, or as a Meta-Learner of a Stacking Ensemble with Decision Trees, Random Forest, and Support Vector Machine classifier algorithms as the Base Learners, while evaluating for optimal hyperparameter combinations (using K-Fold Cross Validation), addressing class imbalance (using Class Weights, Upsampling with Synthetic Minority Oversampling Technique (SMOTE) and Downsampling with Condensed Nearest Neighbors (CNN)), imposing constraints on model coefficient updates (using Least Absolute Shrinkage and Selection Operator and Ridge Regularization), and delivering accurate predictions when applied to new unseen data (using model performance evaluation with F1 Score on Independent Validation and Test Sets). Creating the prototype required cloning the repository containing two application codes and uploading to Streamlit Community Cloud - a Model Prediction Code to compute risk indices, estimate lung cancer probabilities, and predict risk categories; and a User Interface Code to process the study population data as baseline, gather the user input as test case, render all user selections into the visualization charts, execute all computations, estimations and predictions, indicate the test case prediction into the logistic curve plot, and display the prediction results summary. The final lung cancer prediction model was deployed as a Streamlit Web Application.

Machine Learning Case Studies
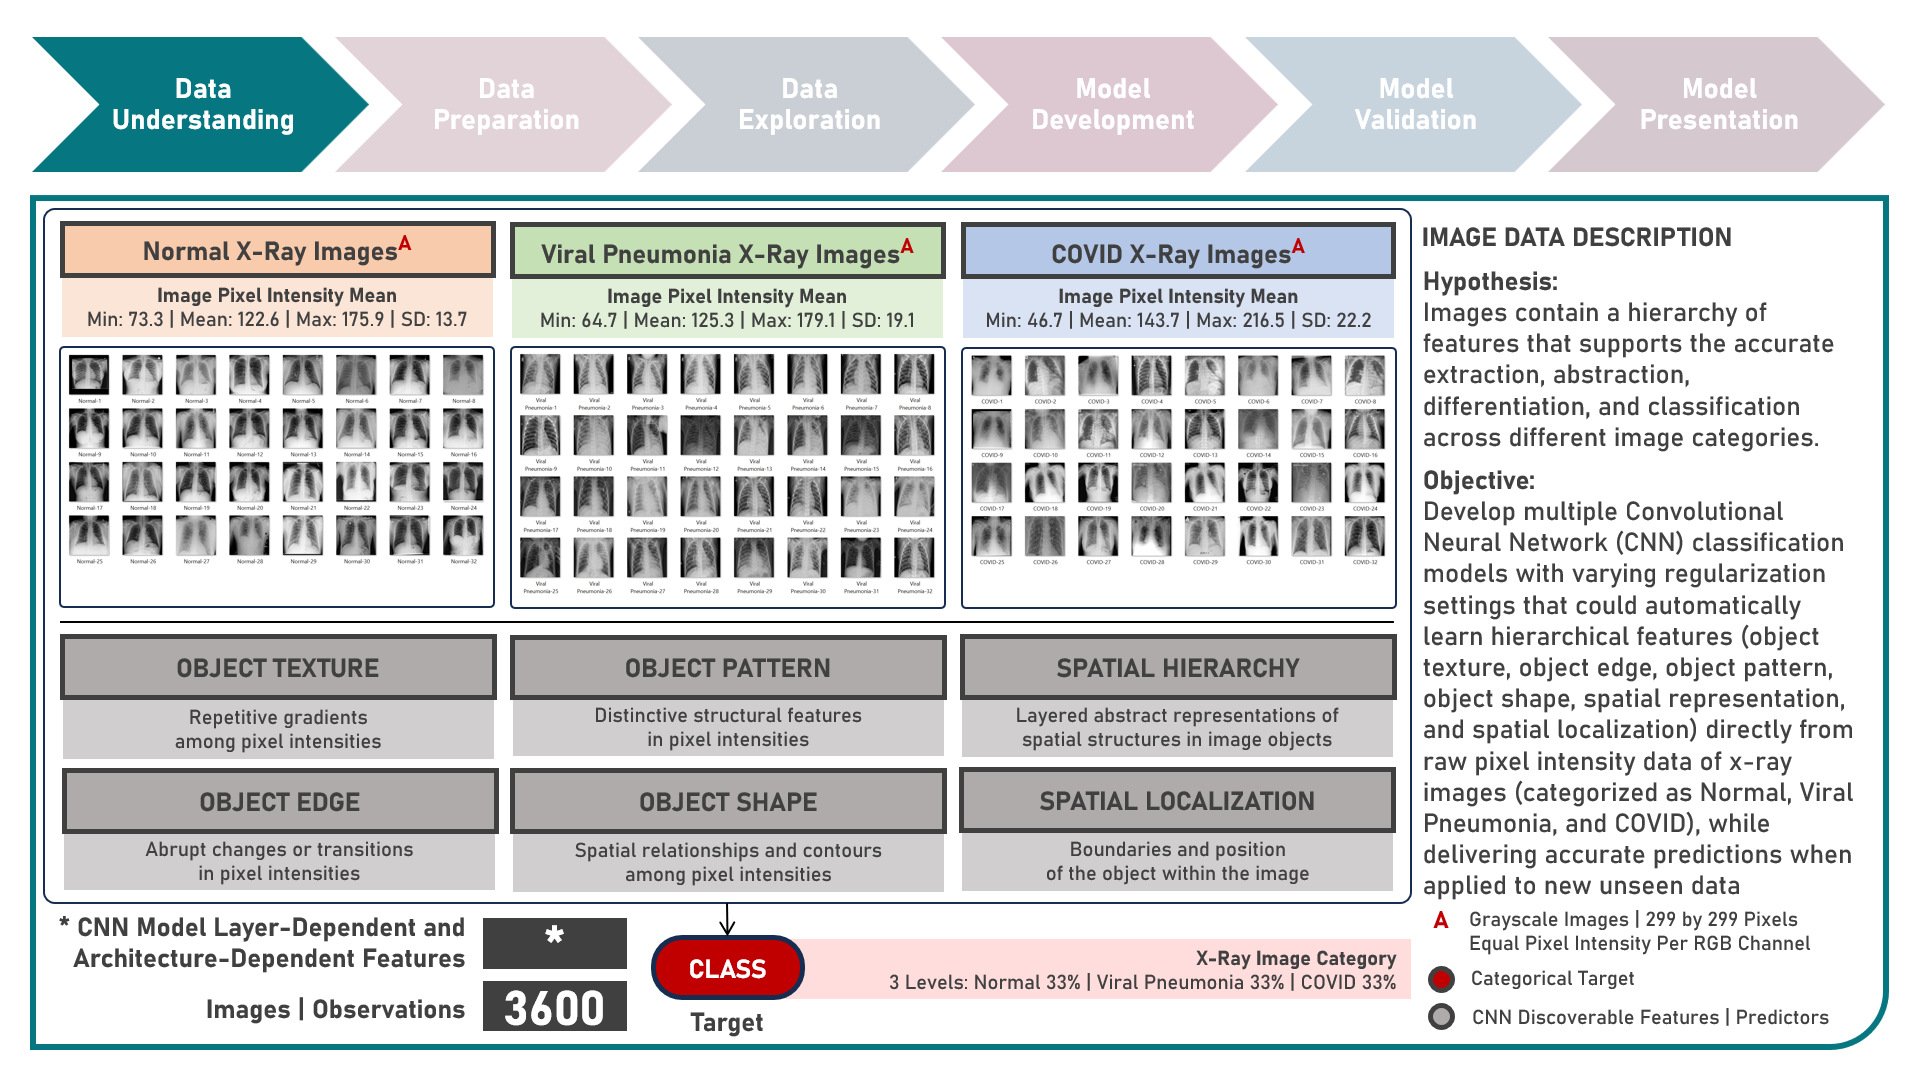
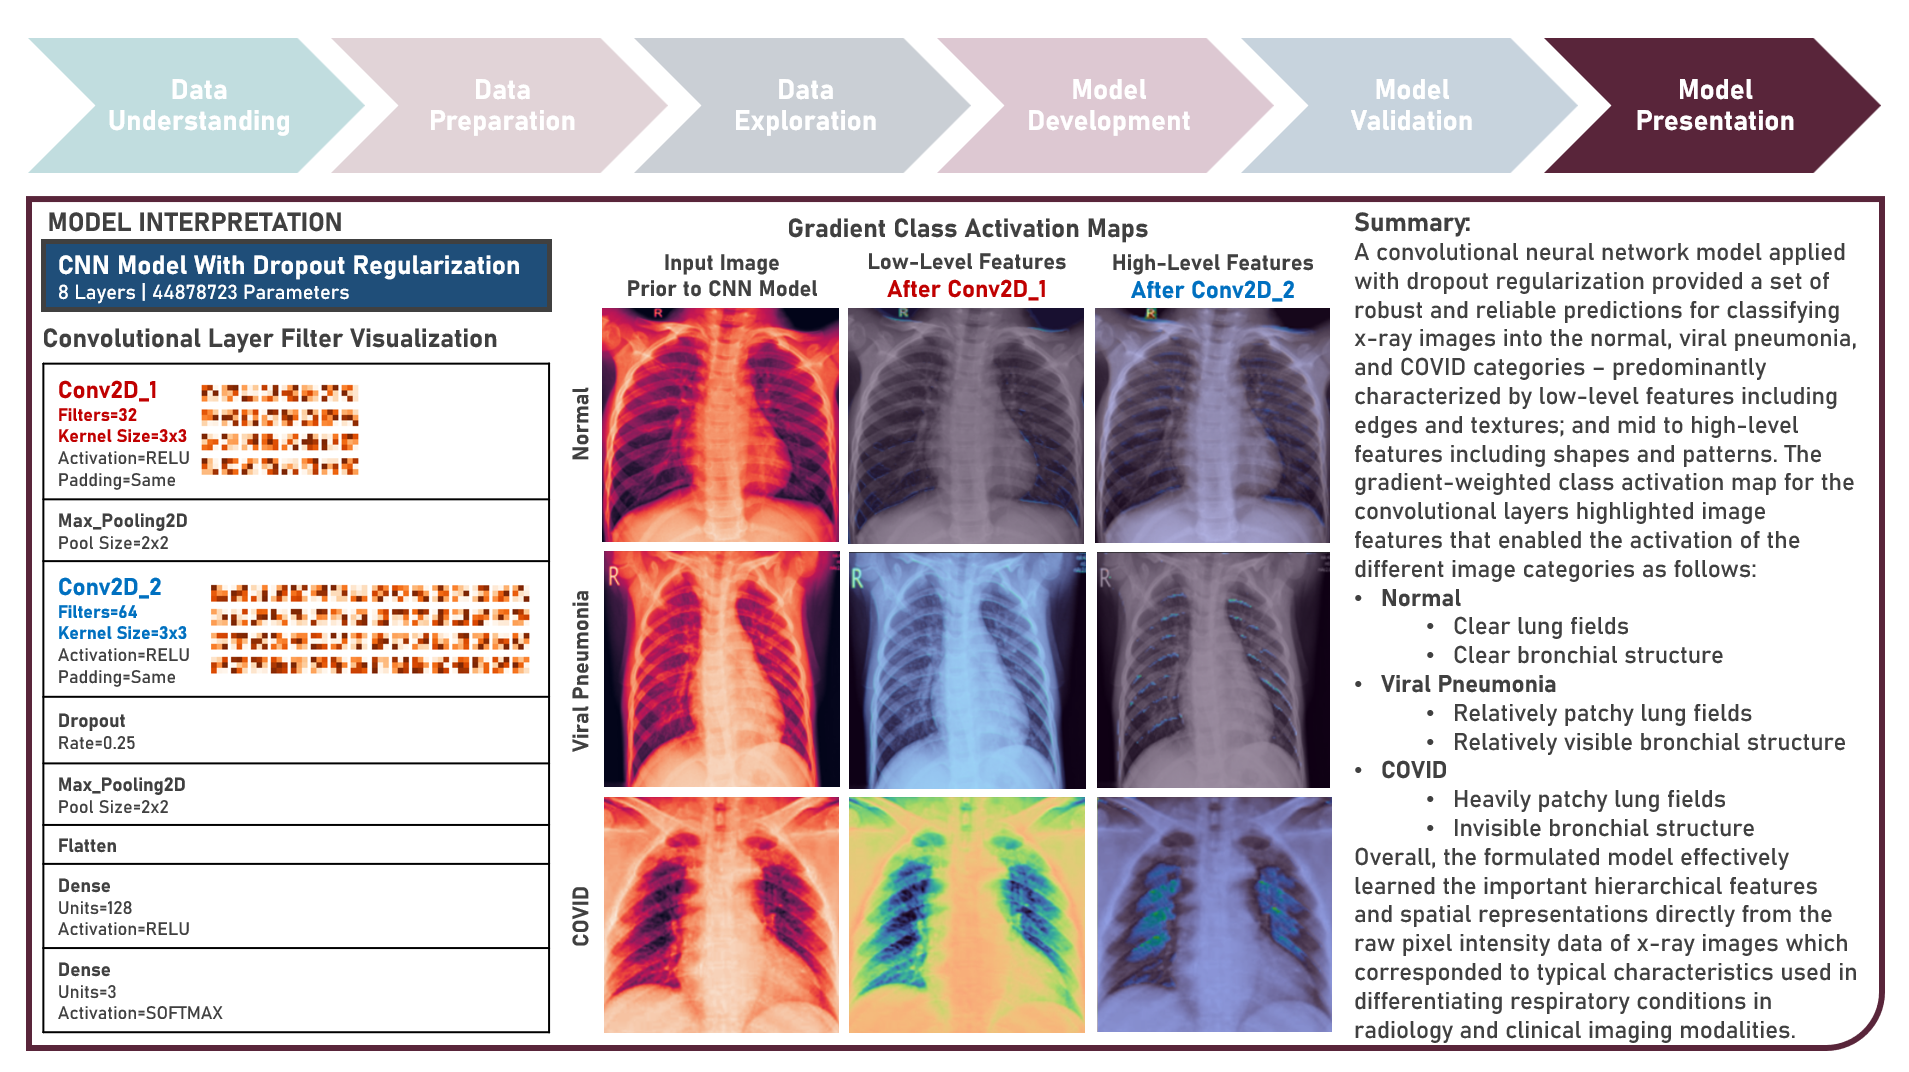
Supervised Learning : Learning Hierarchical Features for Predicting Multiclass X-Ray Images using Convolutional Neural Network Model Variations
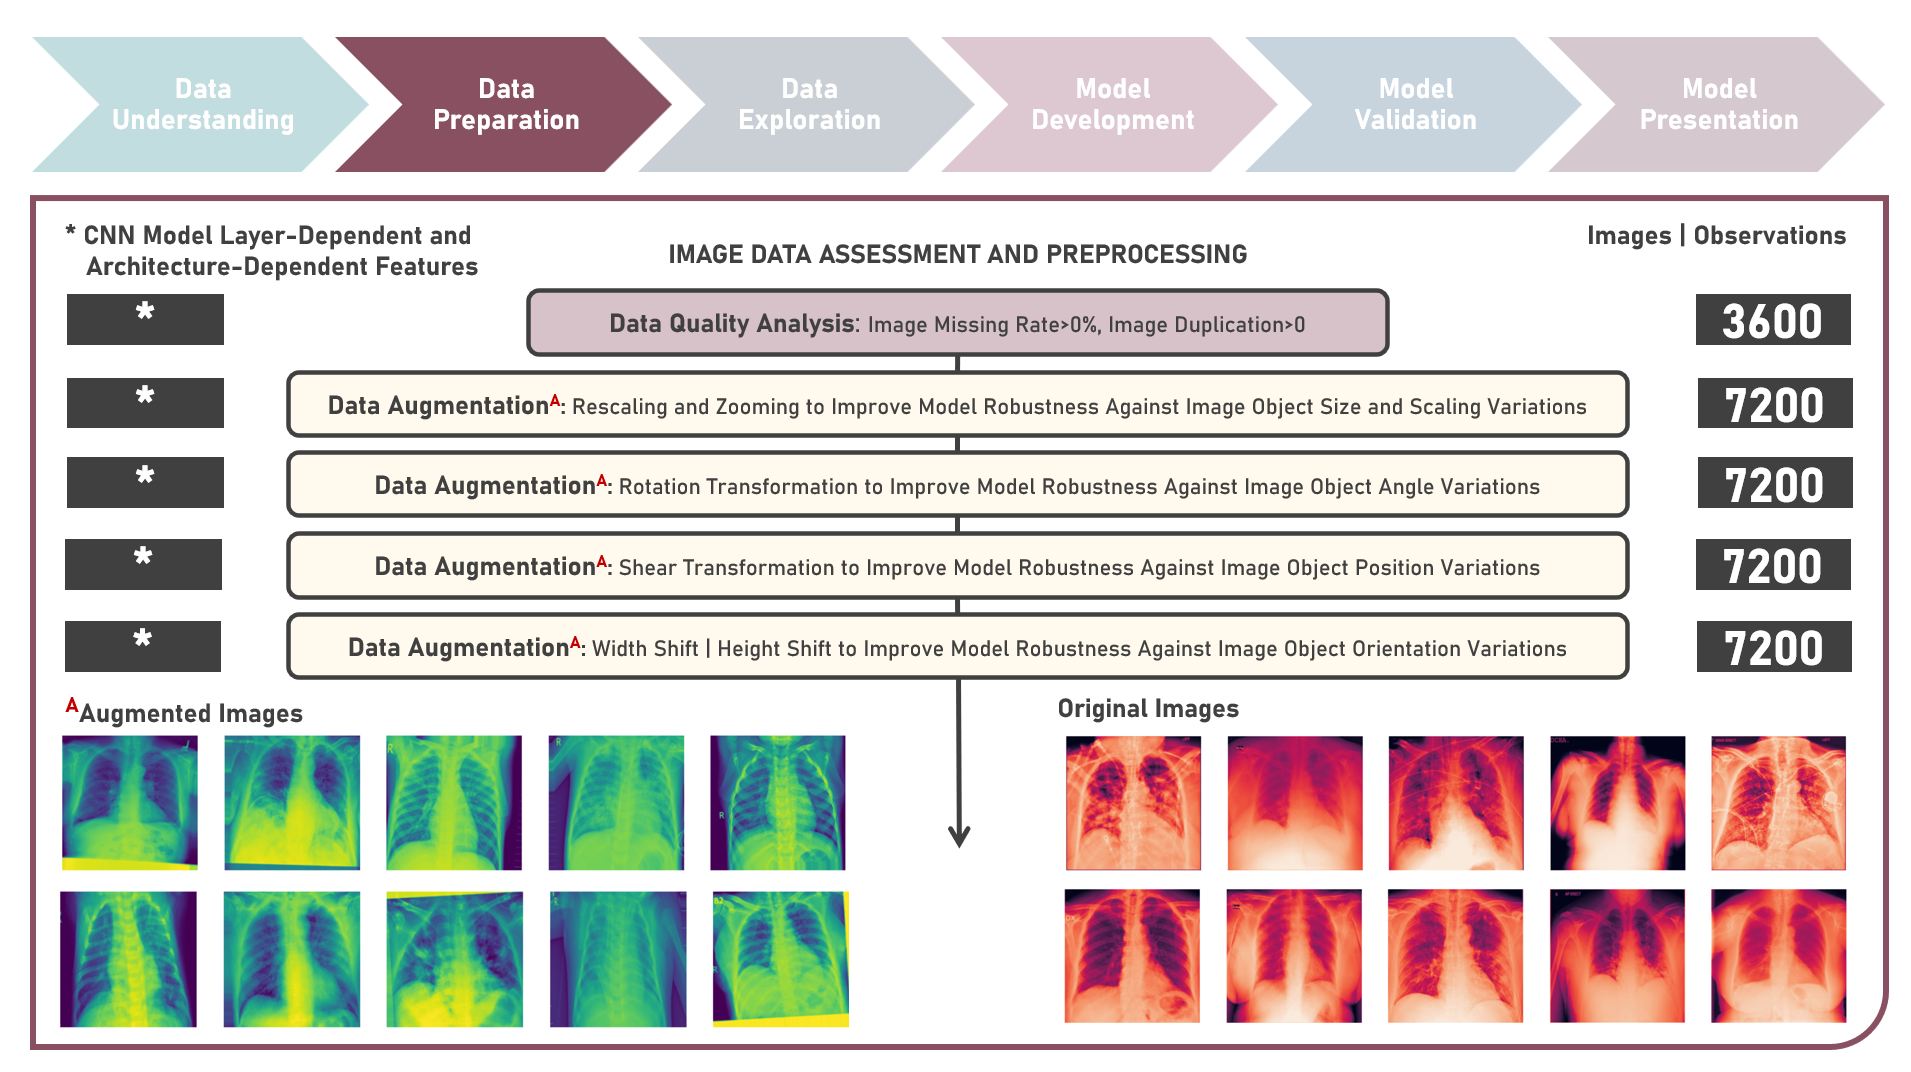
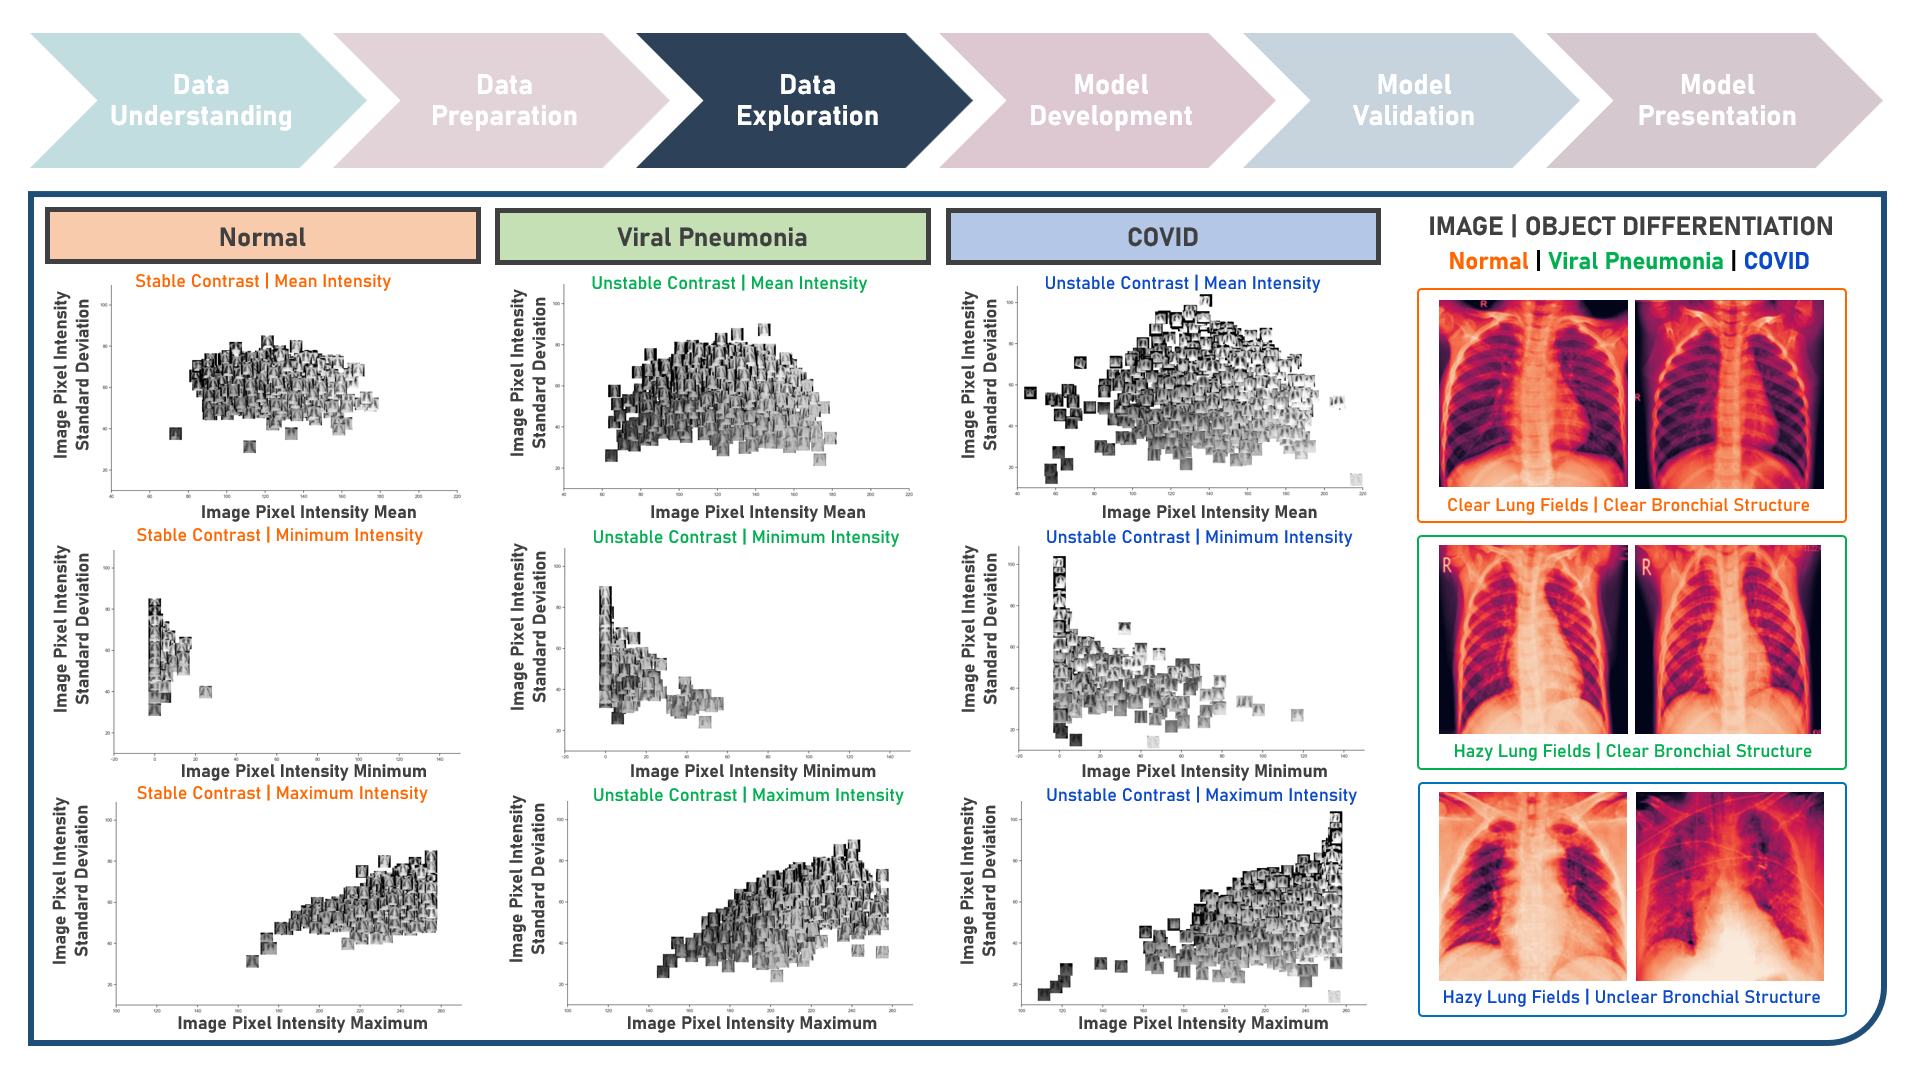
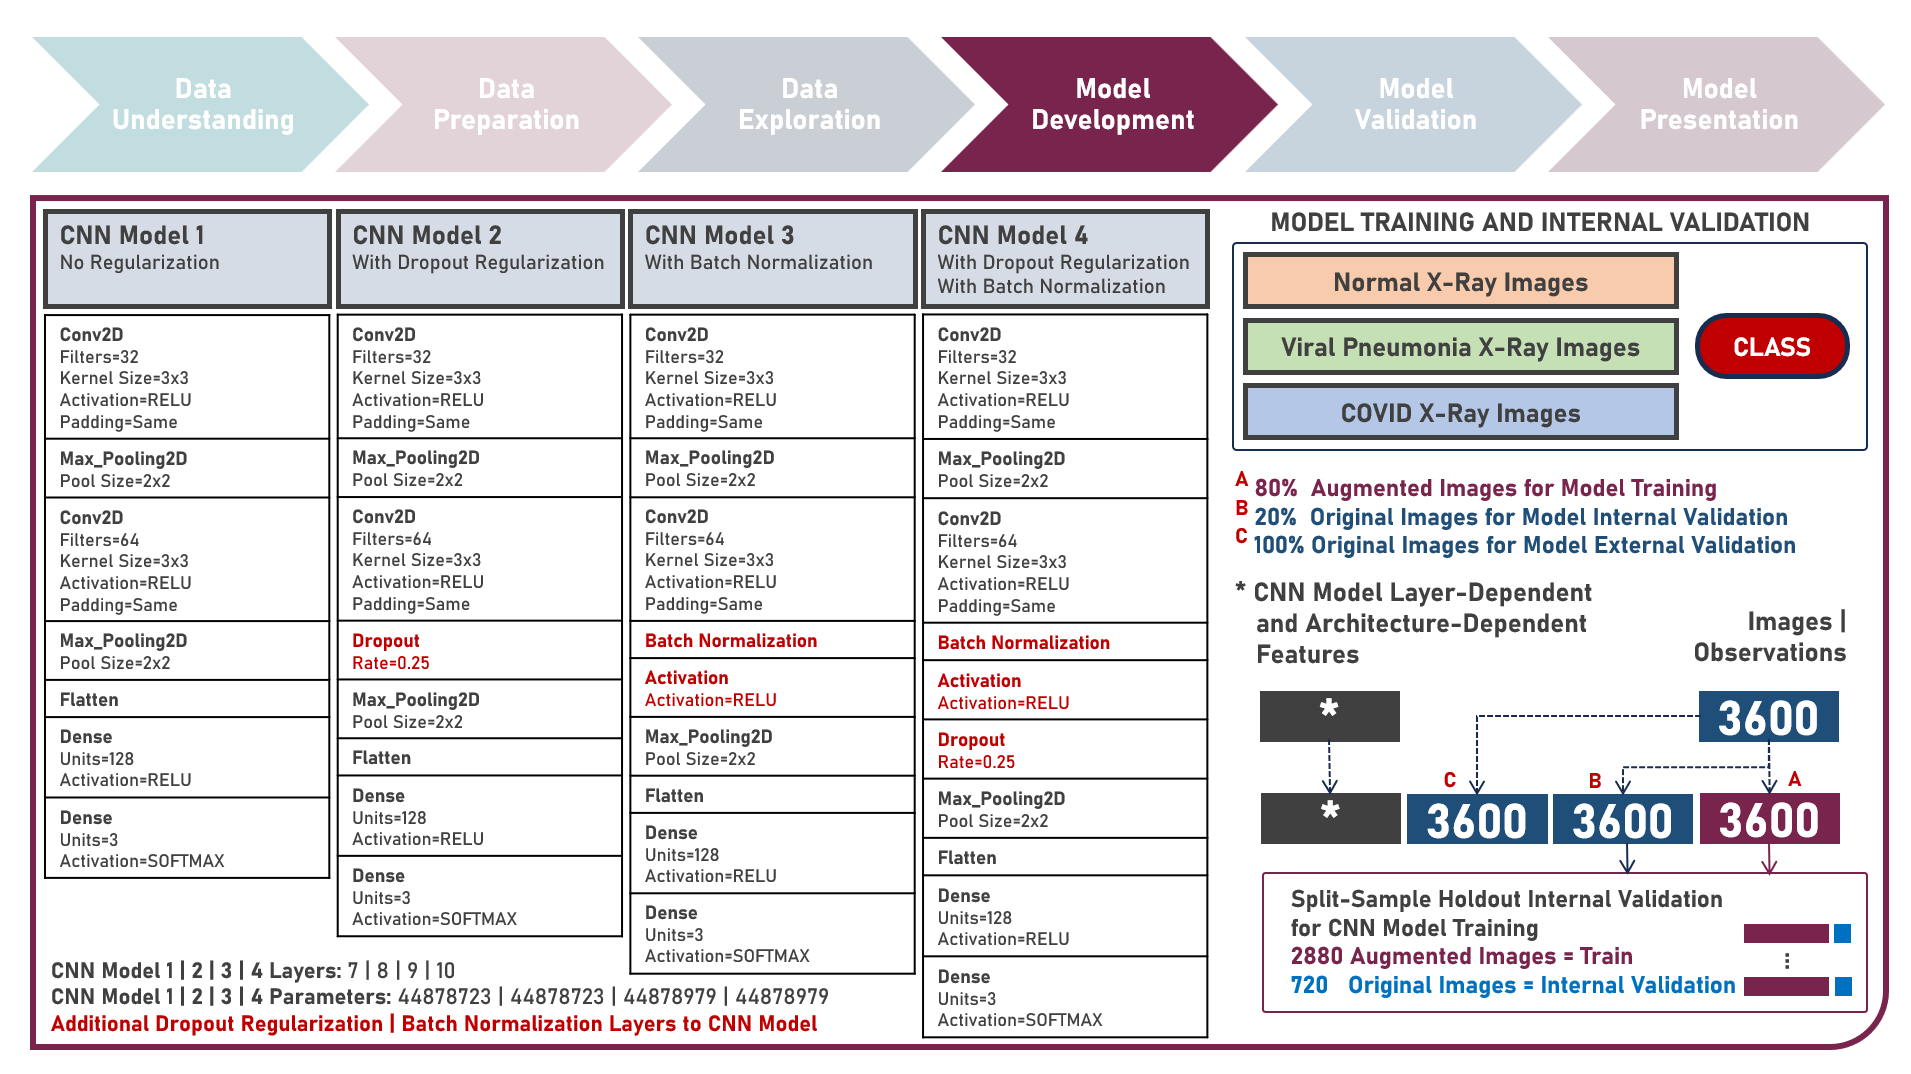
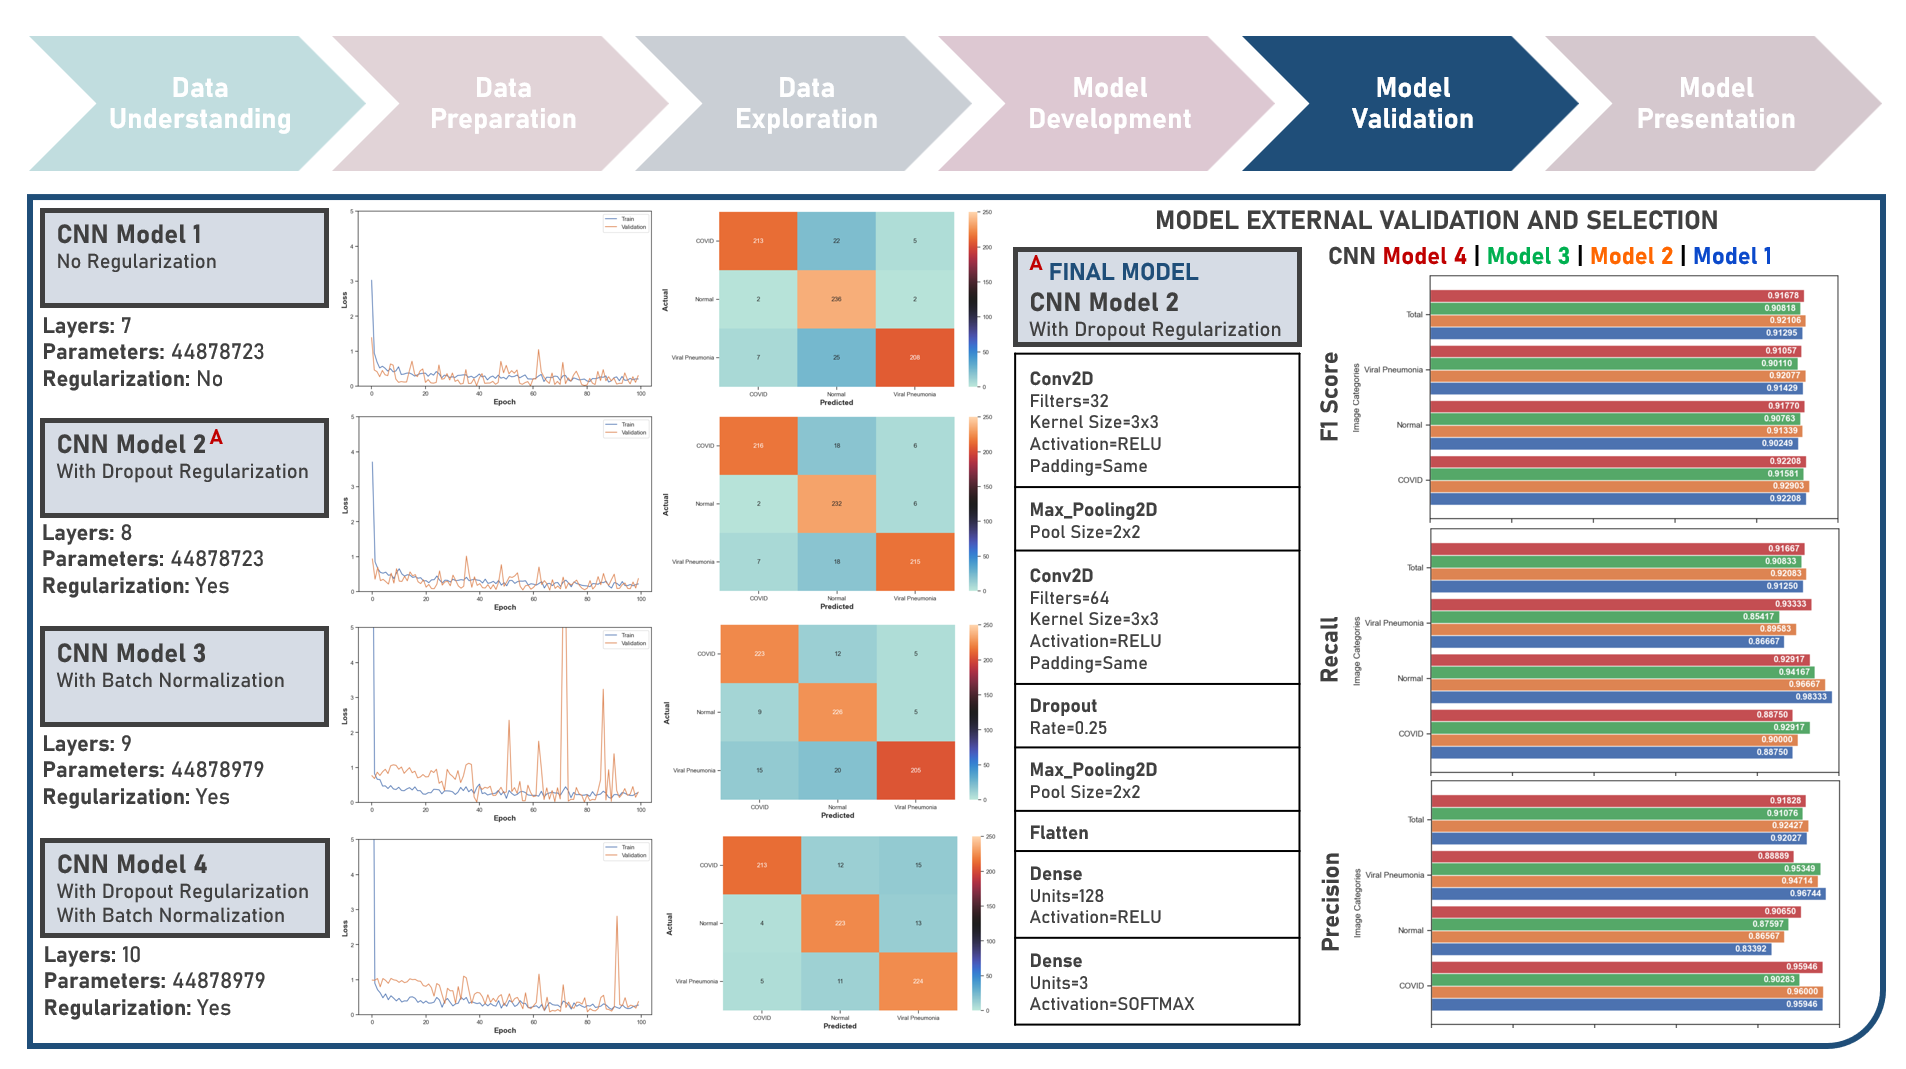
The integration of artificial intelligence (AI) into healthcare has emerged as a transformative force revolutionizing diagnostics and treatment. The urgency of the COVID-19 pandemic has underscored the critical need for rapid and accurate diagnostic tools. One such innovation that holds immense promise is the development of AI prediction models for classifying medical images in respiratory health. This case study aims to develop multiple convolutional neural network (CNN) classification models that could automatically learn hierarchical features directly from raw pixel data of x-ray images (categorized as Normal, Viral Pneumonia, and COVID-19), while exploring insights into the features that influenced model prediction. Data quality assessment was conducted on the initial dataset to identify and remove cases noted with irregularities, in addition to the subsequent preprocessing operations to improve generalization and reduce sensitivity to variations most suitable for the downstream analysis. Multiple CNN models were developed with various combinations of regularization techniques namely, Dropout for preventing overfitting by randomly dropping out neurons during training, and Batch Normalization for standardizing the input of each layer to stabilize and accelerate training. CNN With No Regularization, CNN With Dropout Regularization, CNN With Batch Normalization Regularization, and CNN With Dropout and Batch Normalization Regularization were formulated to discover hierarchical and spatial representations for image category prediction. Epoch training was optimized through internal validation using Split-Sample Holdout with F1 Score used as the primary performance metric among Precision and Recall. All candidate models were compared based on internal validation performance. Post-hoc exploration of the model results involved Convolutional Layer Filter Visualization and Gradient Class Activation Mapping methods to highlight both low- and high-level features from the image objects that lead to the activation of the different image categories. These results helped provide insights into the important hierarchical and spatial representations for image category differentiation and model prediction.

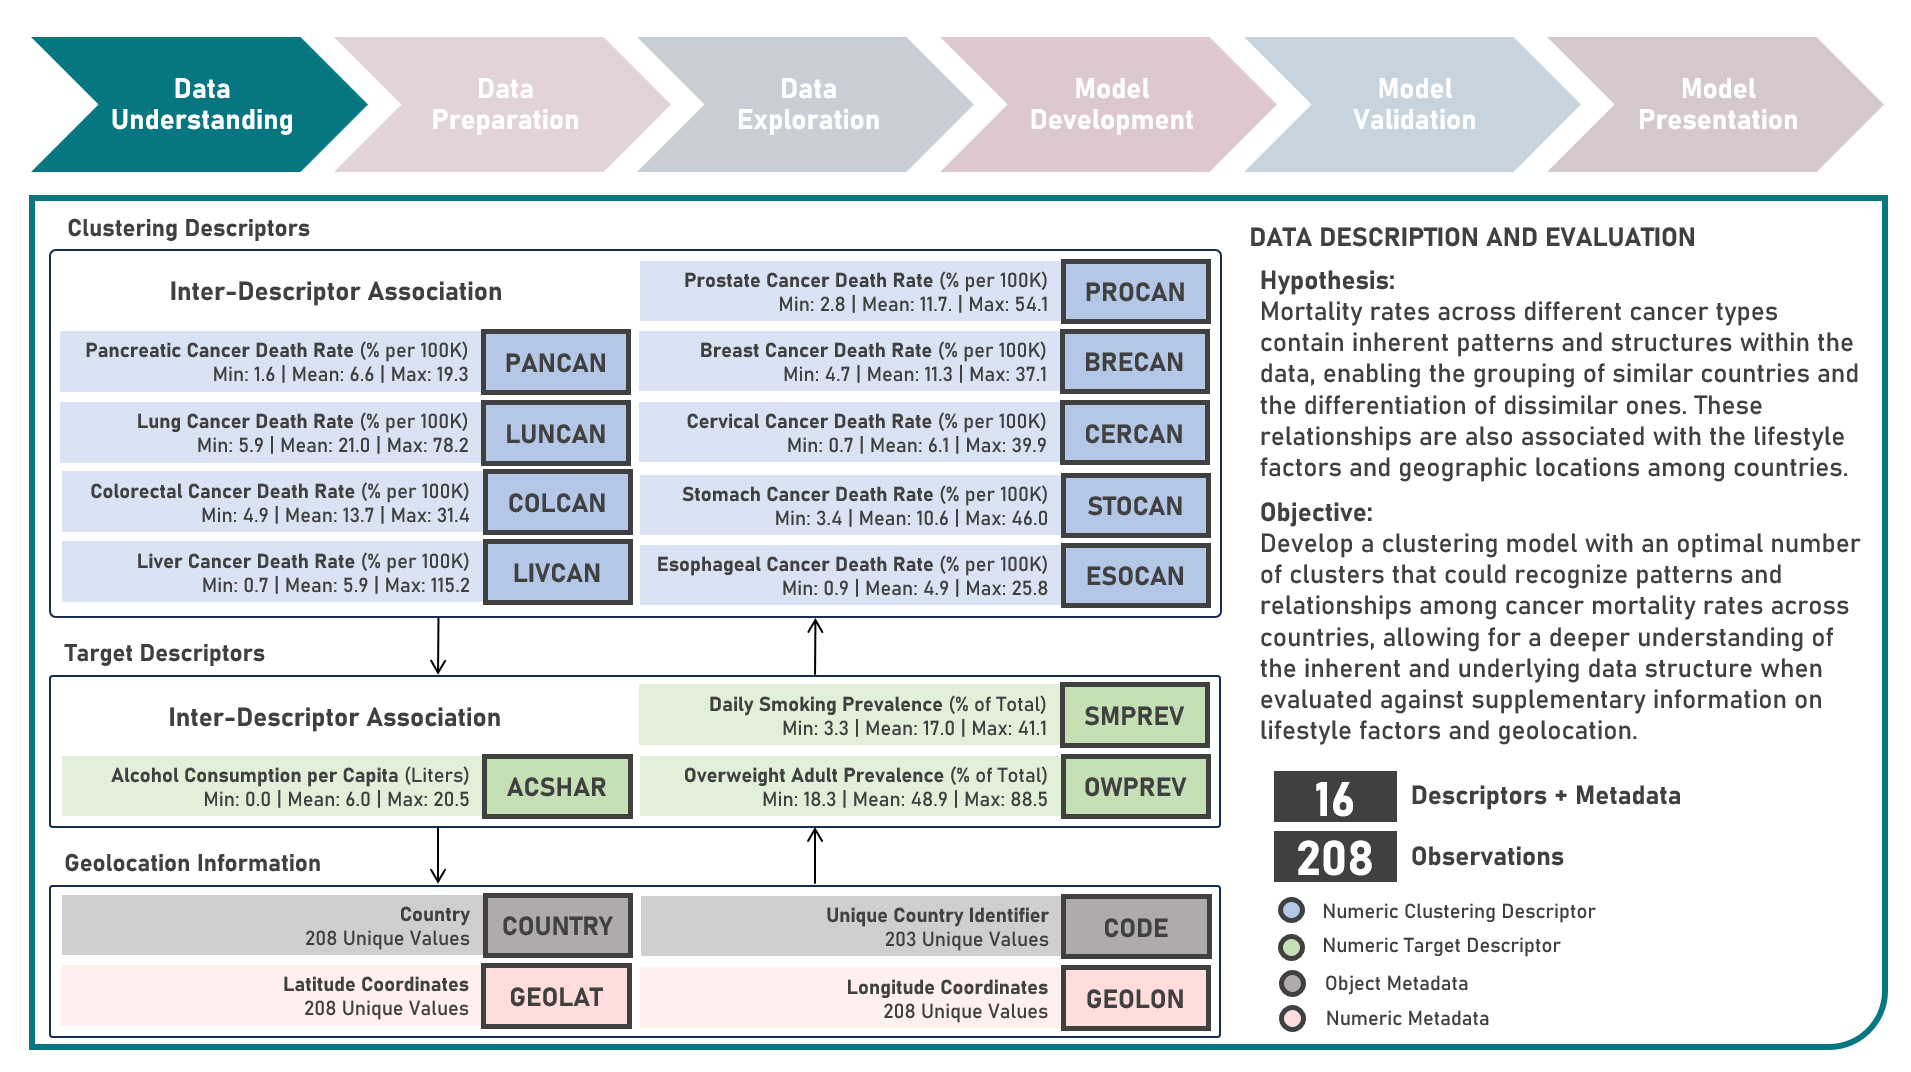
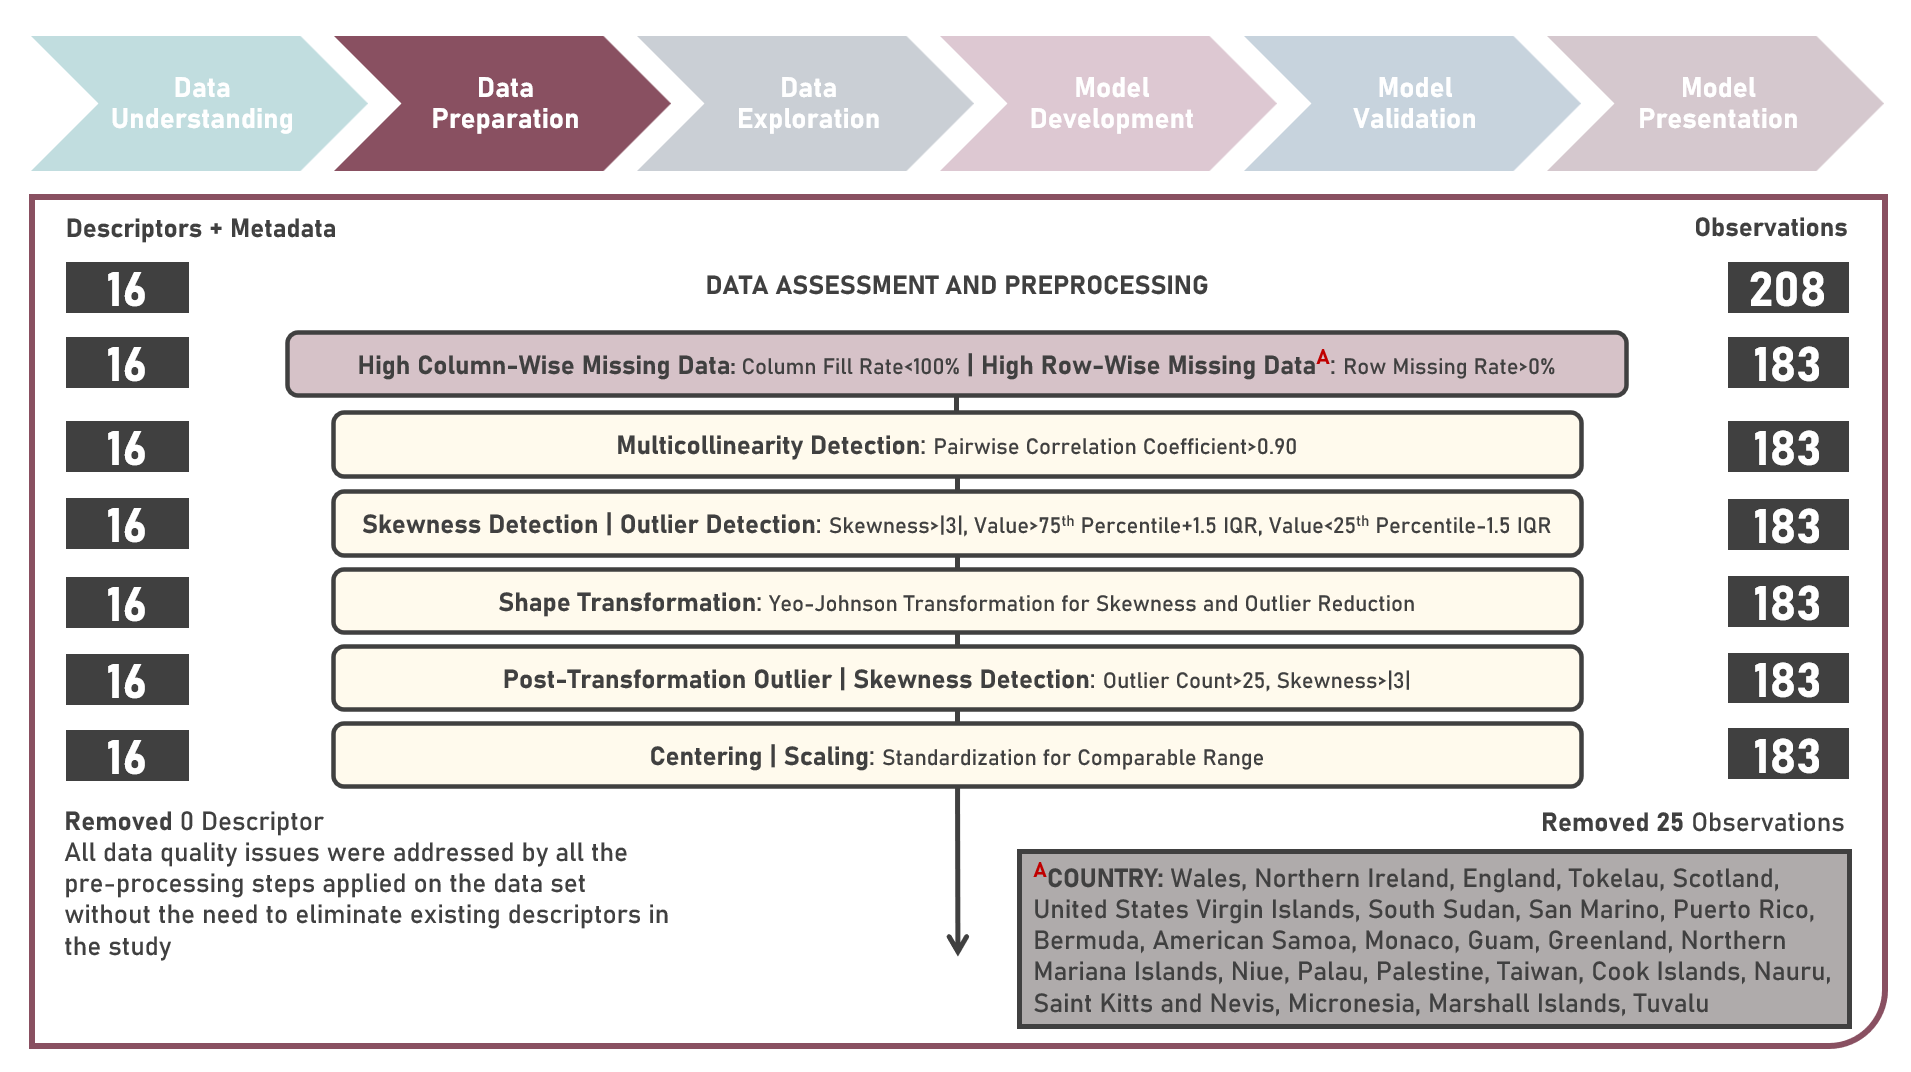
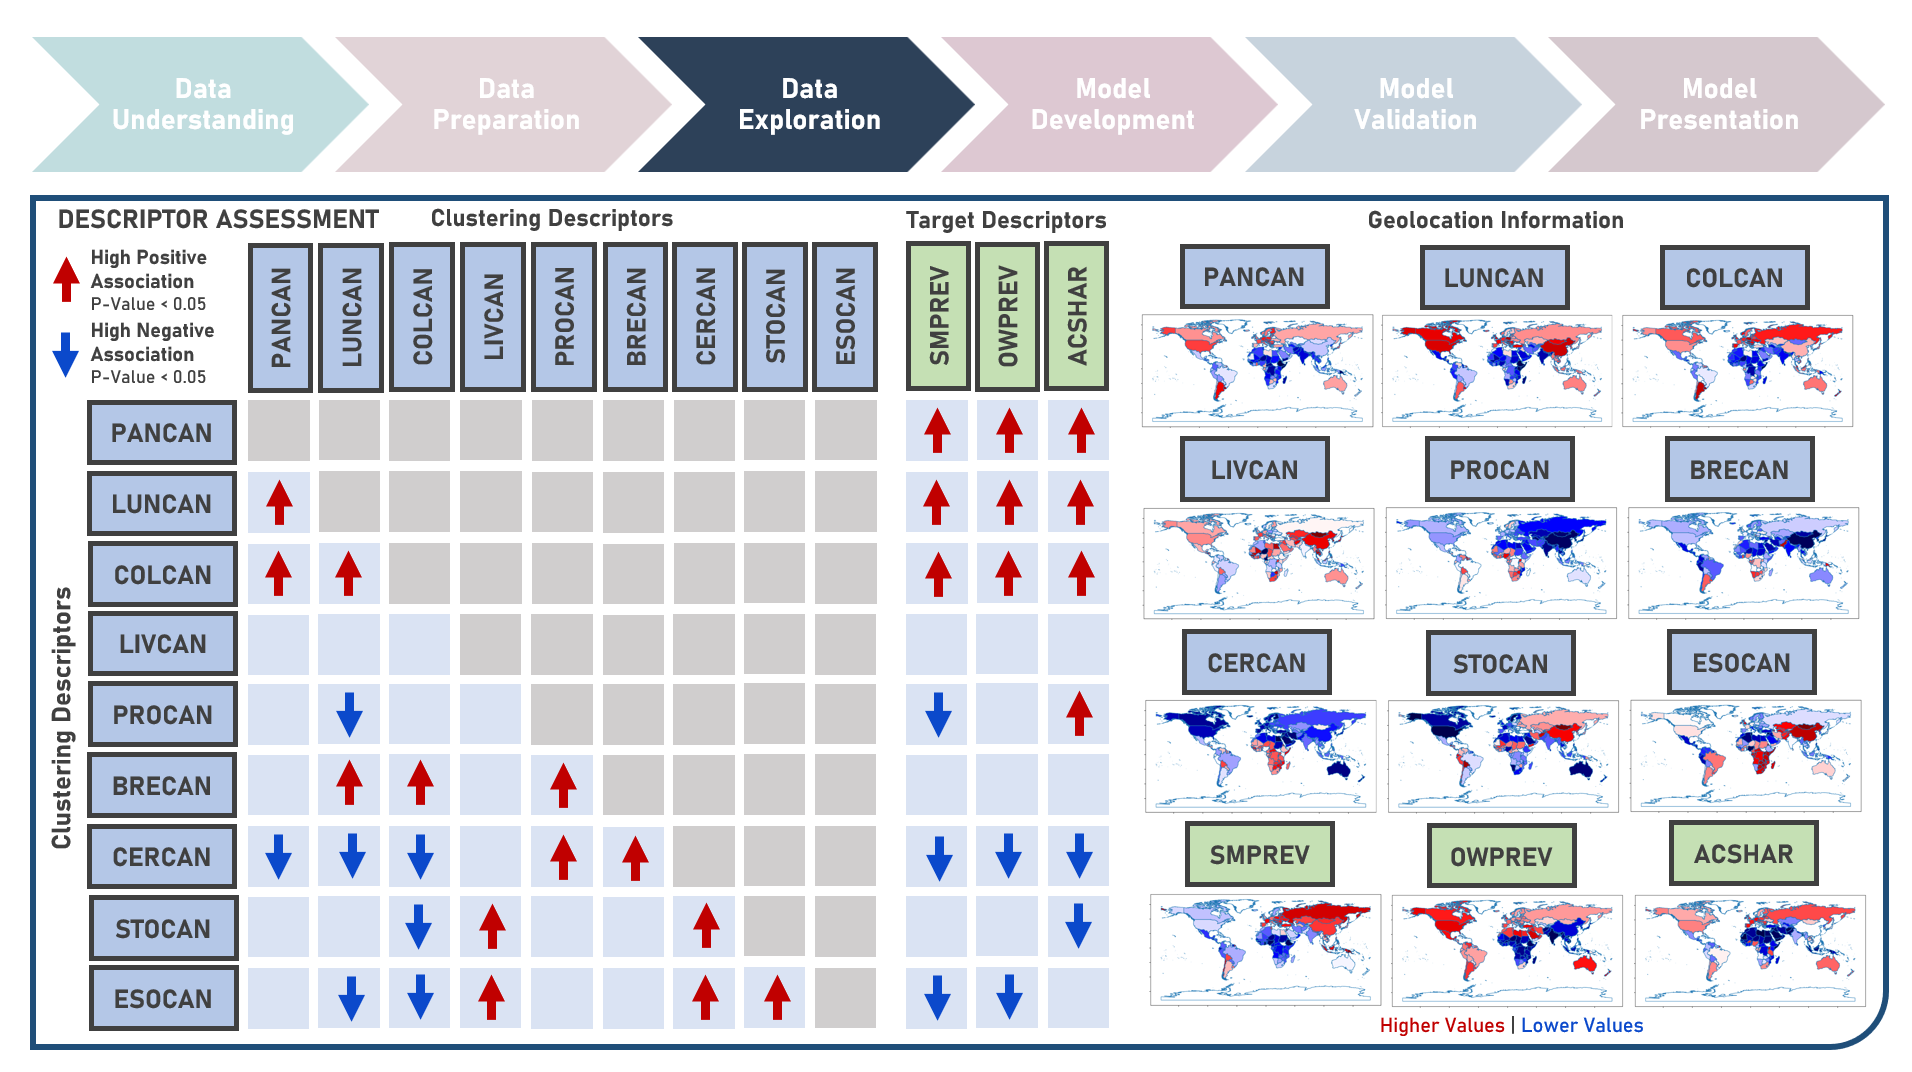
Unsupervised Learning : Discovering Global Patterns in Cancer Mortality Across Countries Via Clustering Analysis
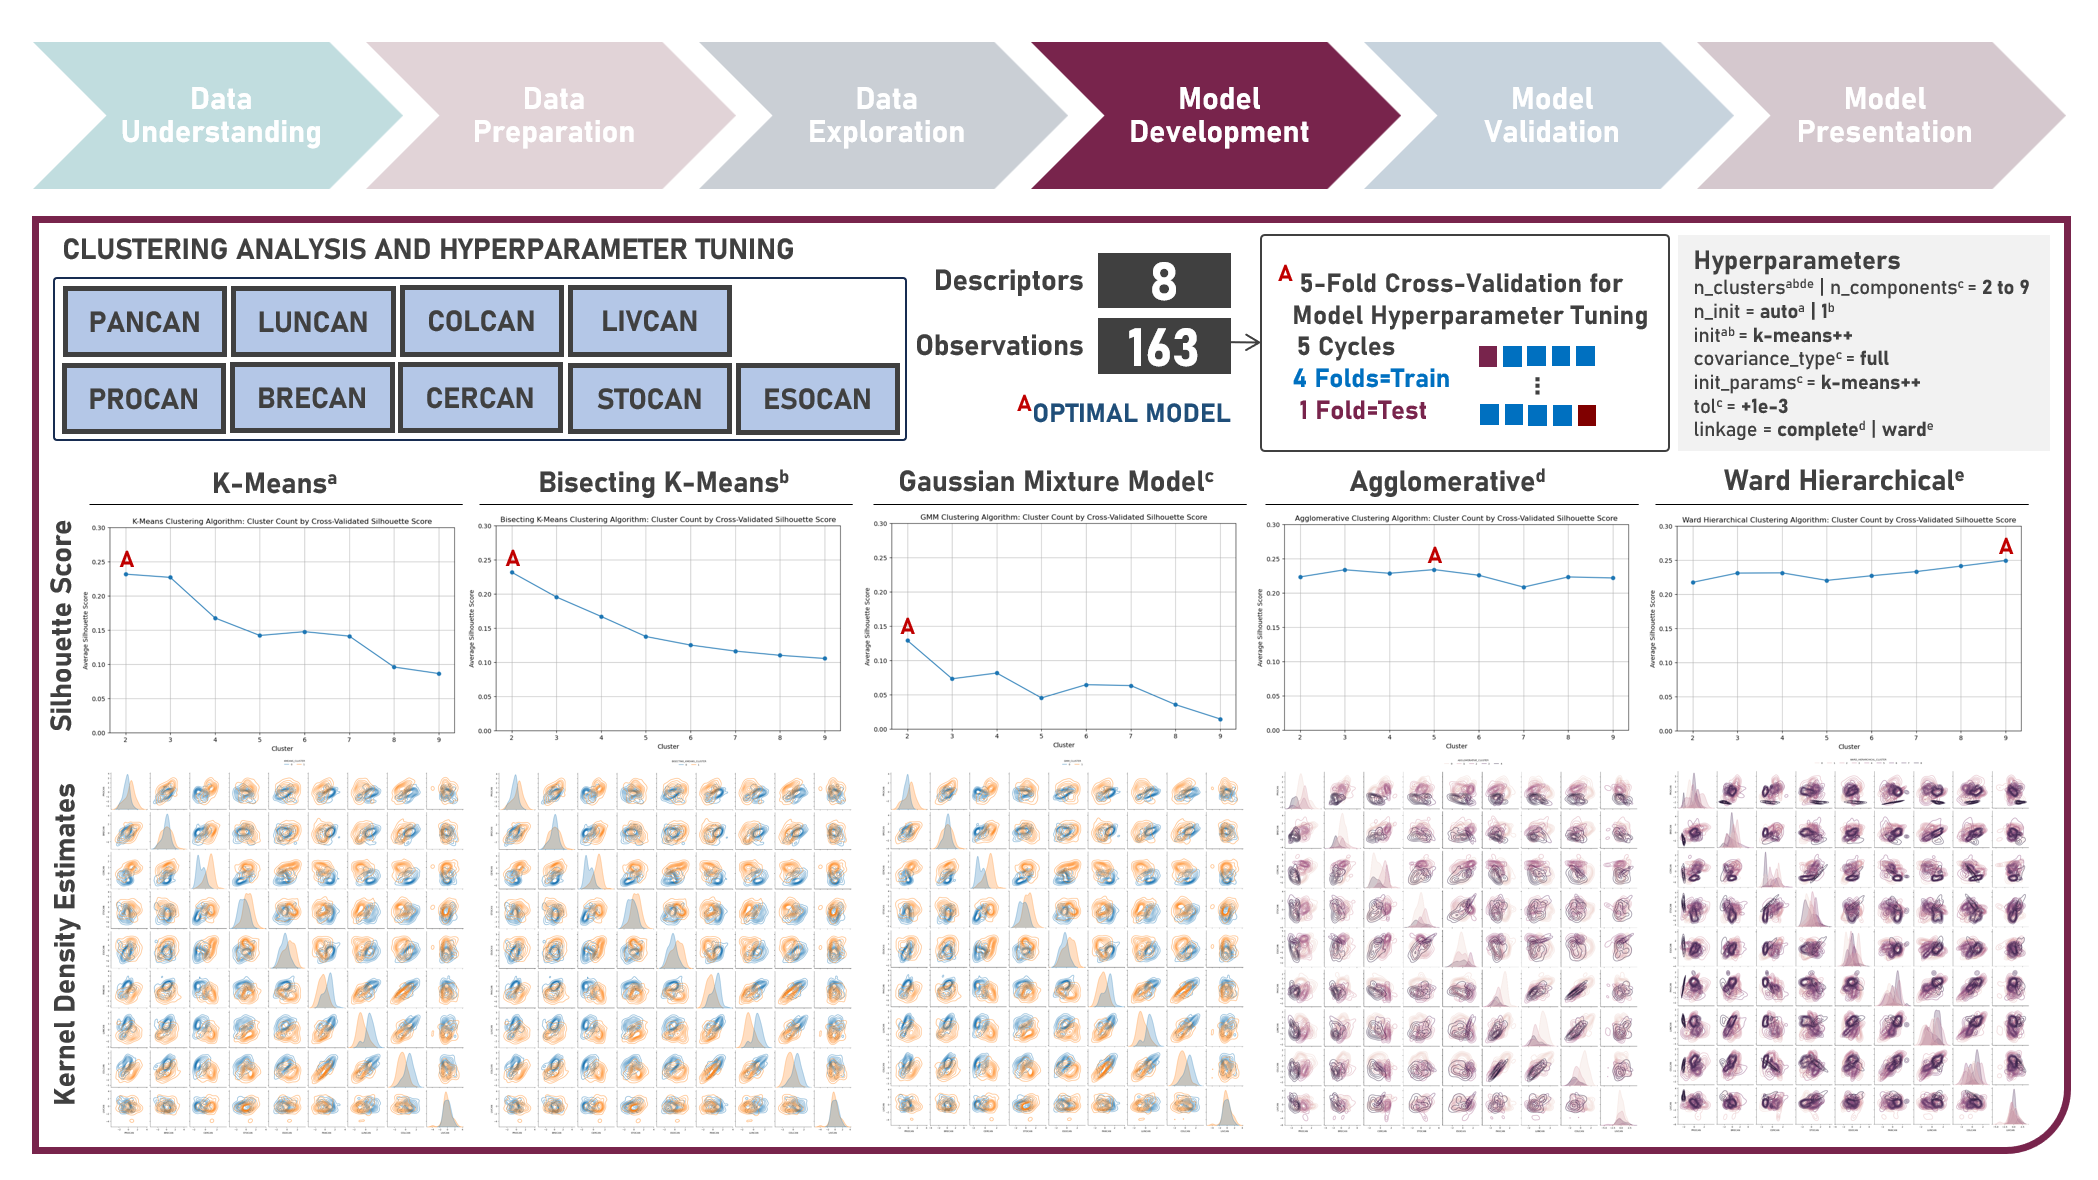
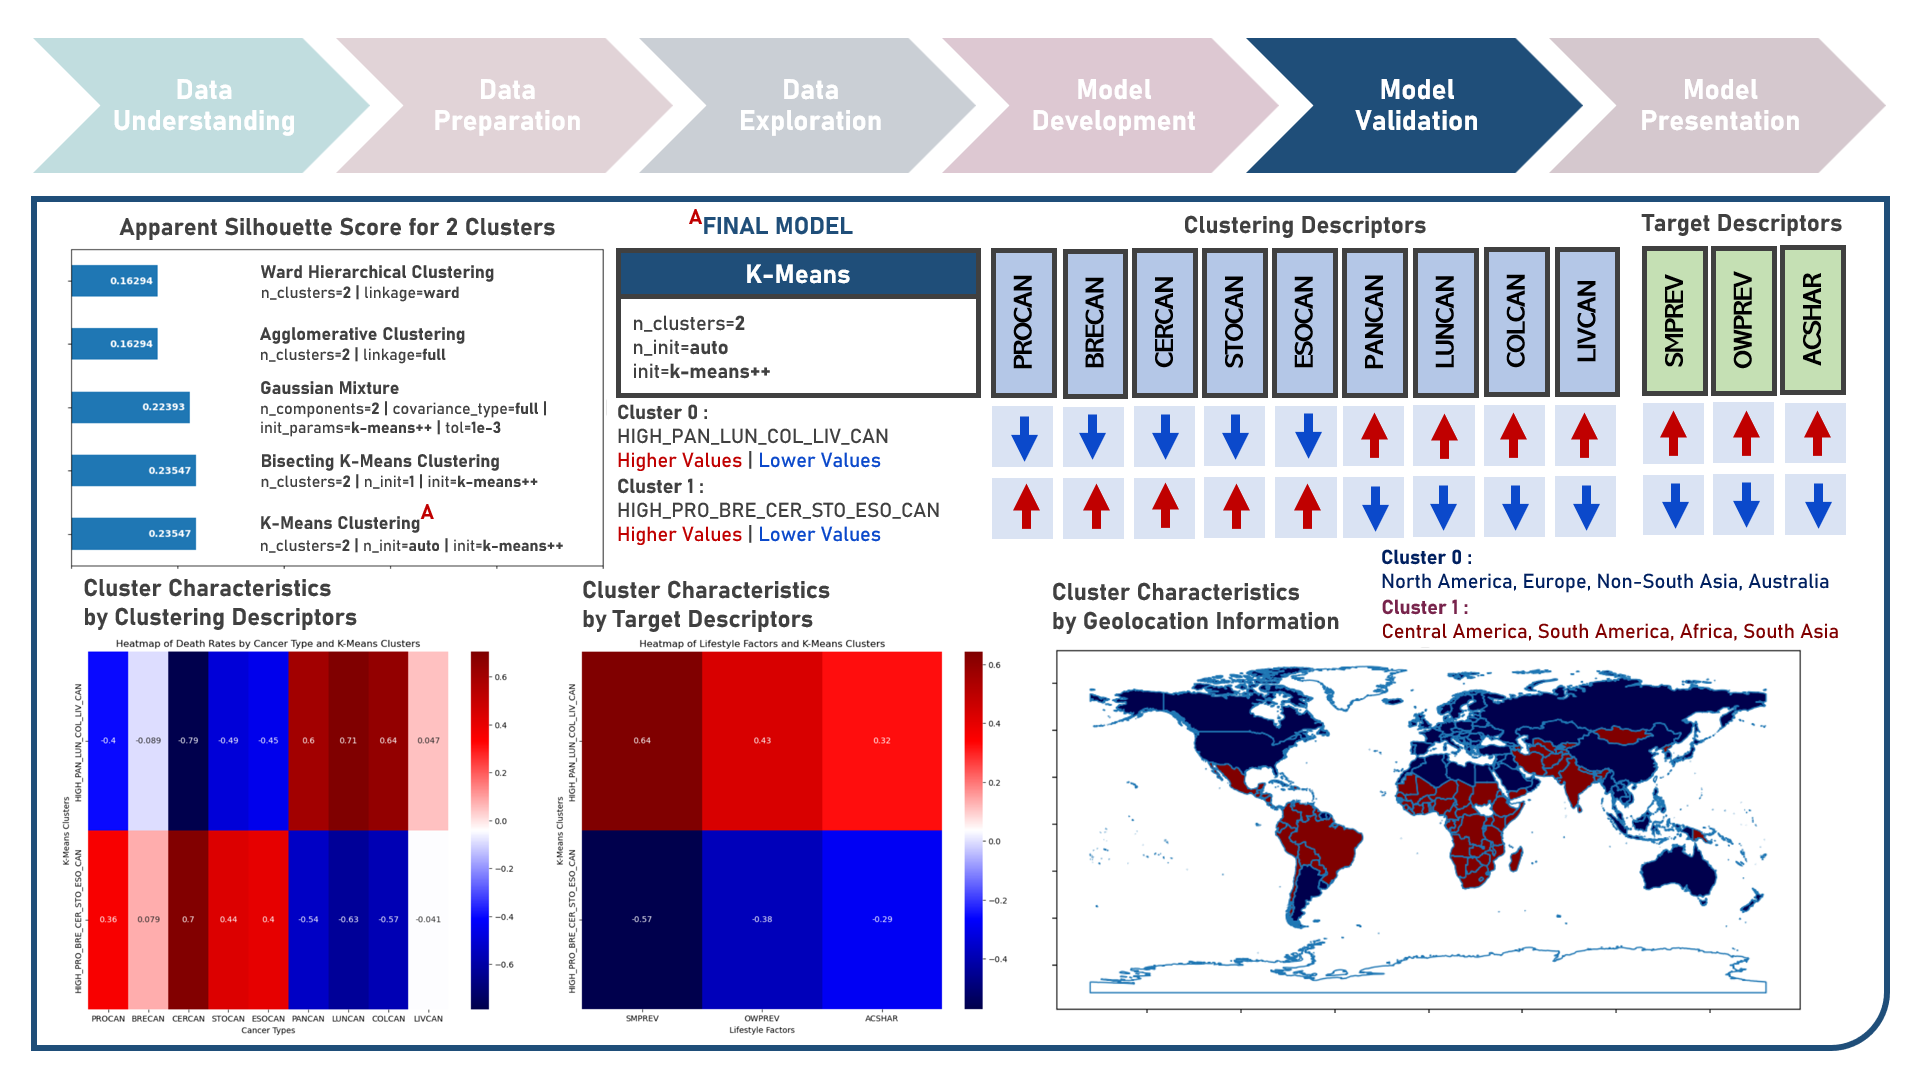
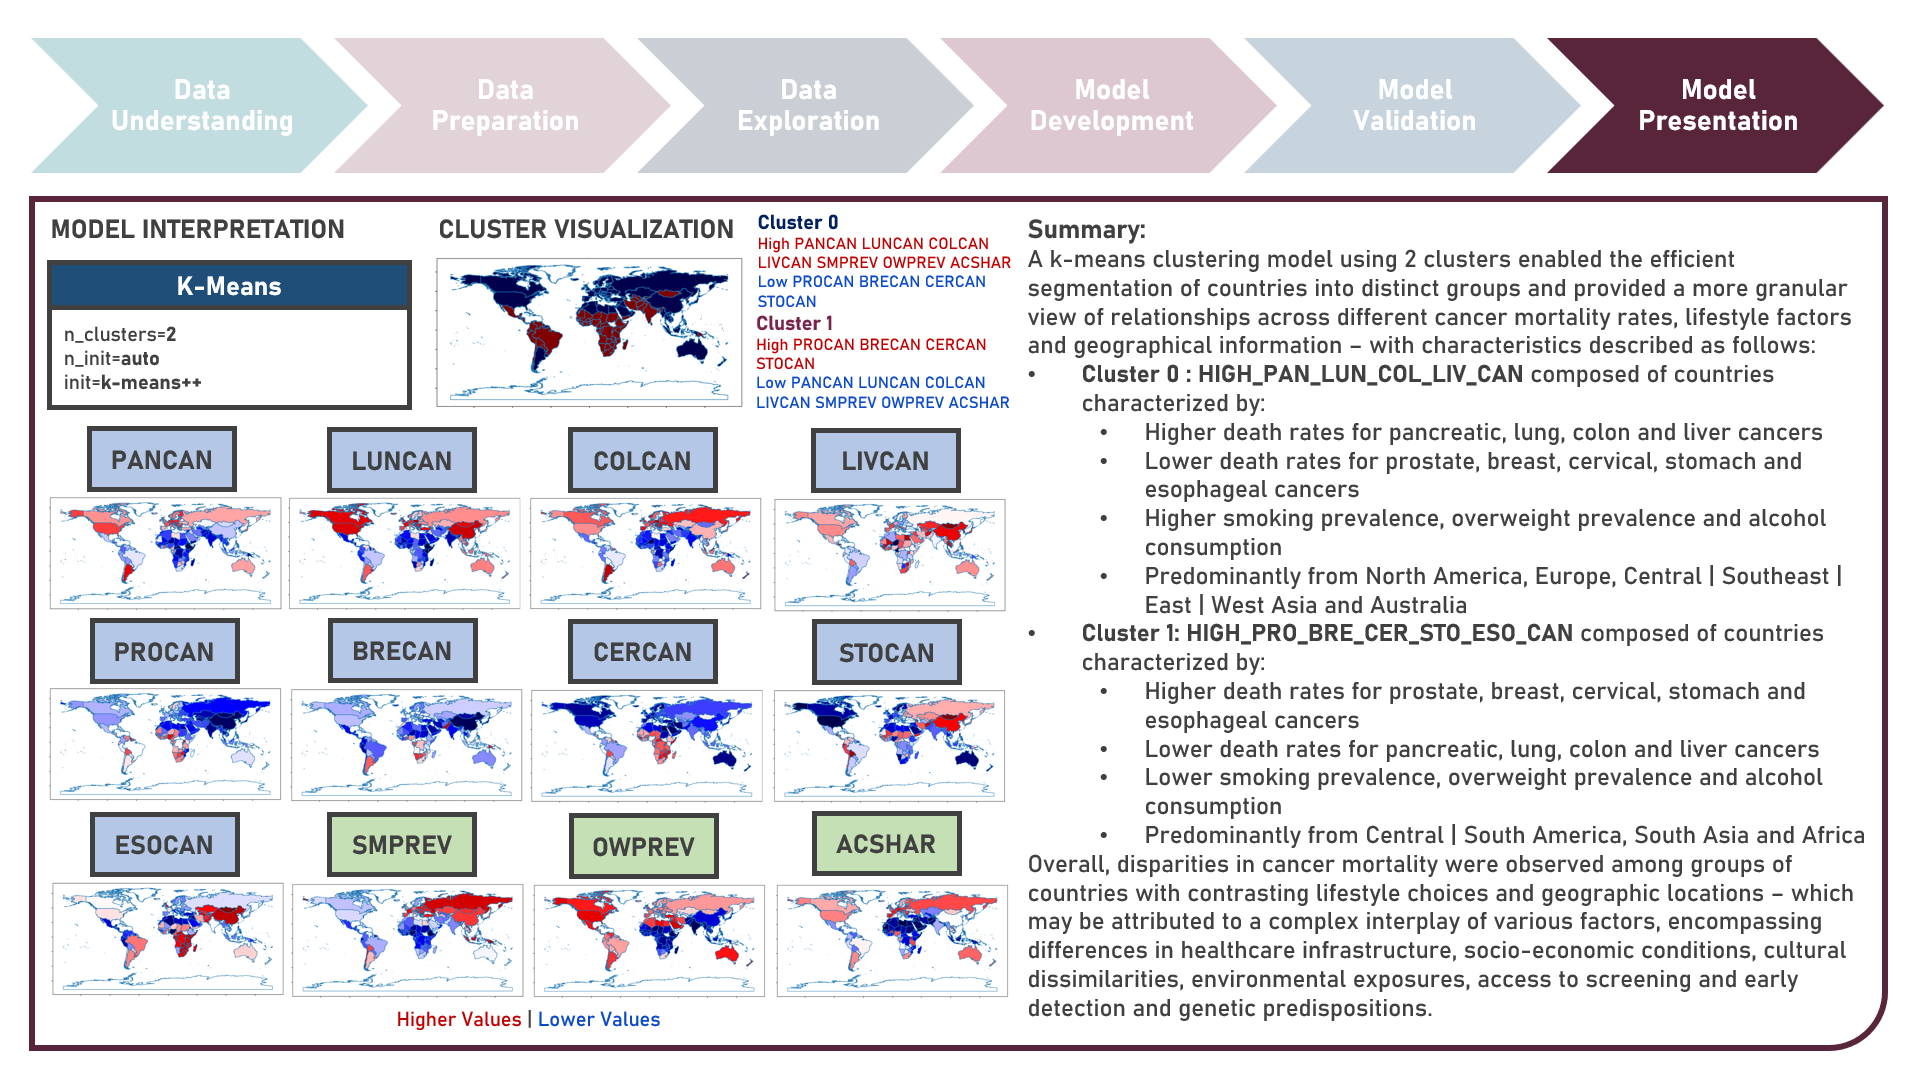
Age-standardized cancer mortality rates refer to the number of deaths attributed to cancer within a specific population over a given period, usually expressed as the number of deaths per 100,000 people adjusted for differences in age distribution. Monitoring cancer mortality rates allows public health authorities to track the burden of cancer, understand the prevalence of different cancer types and identify variations in different populations. Studying these metrics is essential for making accurate cross-country comparisons, identifying high-risk communities, informing public health policies, and supporting international efforts to address the global burden of cancer. This case study aims to develop a clustering model with an optimal number of clusters that could recognize patterns and relationships among cancer mortality rates across countries, allowing for a deeper understanding of the inherent and underlying data structure when evaluated against supplementary information on lifestyle factors and geolocation. Data quality assessment was conducted on the initial dataset to identify and remove cases noted with irregularities, in addition to the subsequent preprocessing operations most suitable for the downstream analysis. Multiple clustering modelling algorithms with various cluster counts were formulated using K-Means, Bisecting K-Means, Gaussian Mixture Model, Agglomerative and Ward Hierarchical methods. The best model with optimized hyperparameters from each algorithm was determined through internal resampling validation applying 5-Fold Cross Validation with the Silhouette Score used as the primary performance metric. Due to the unsupervised learning nature of the analysis, all candidate models were compared based on internal validation and apparent performance. Post-hoc exploration of the model results involved clustering visualization methods using Pair Plots, Heat Maps and Geographic Maps - providing an intuitive method to investigate and understand the characteristics of the discovered cancer clusters. These findings aided in the formulation of insights on the relationship and association of the various descriptors for the clusters identified.

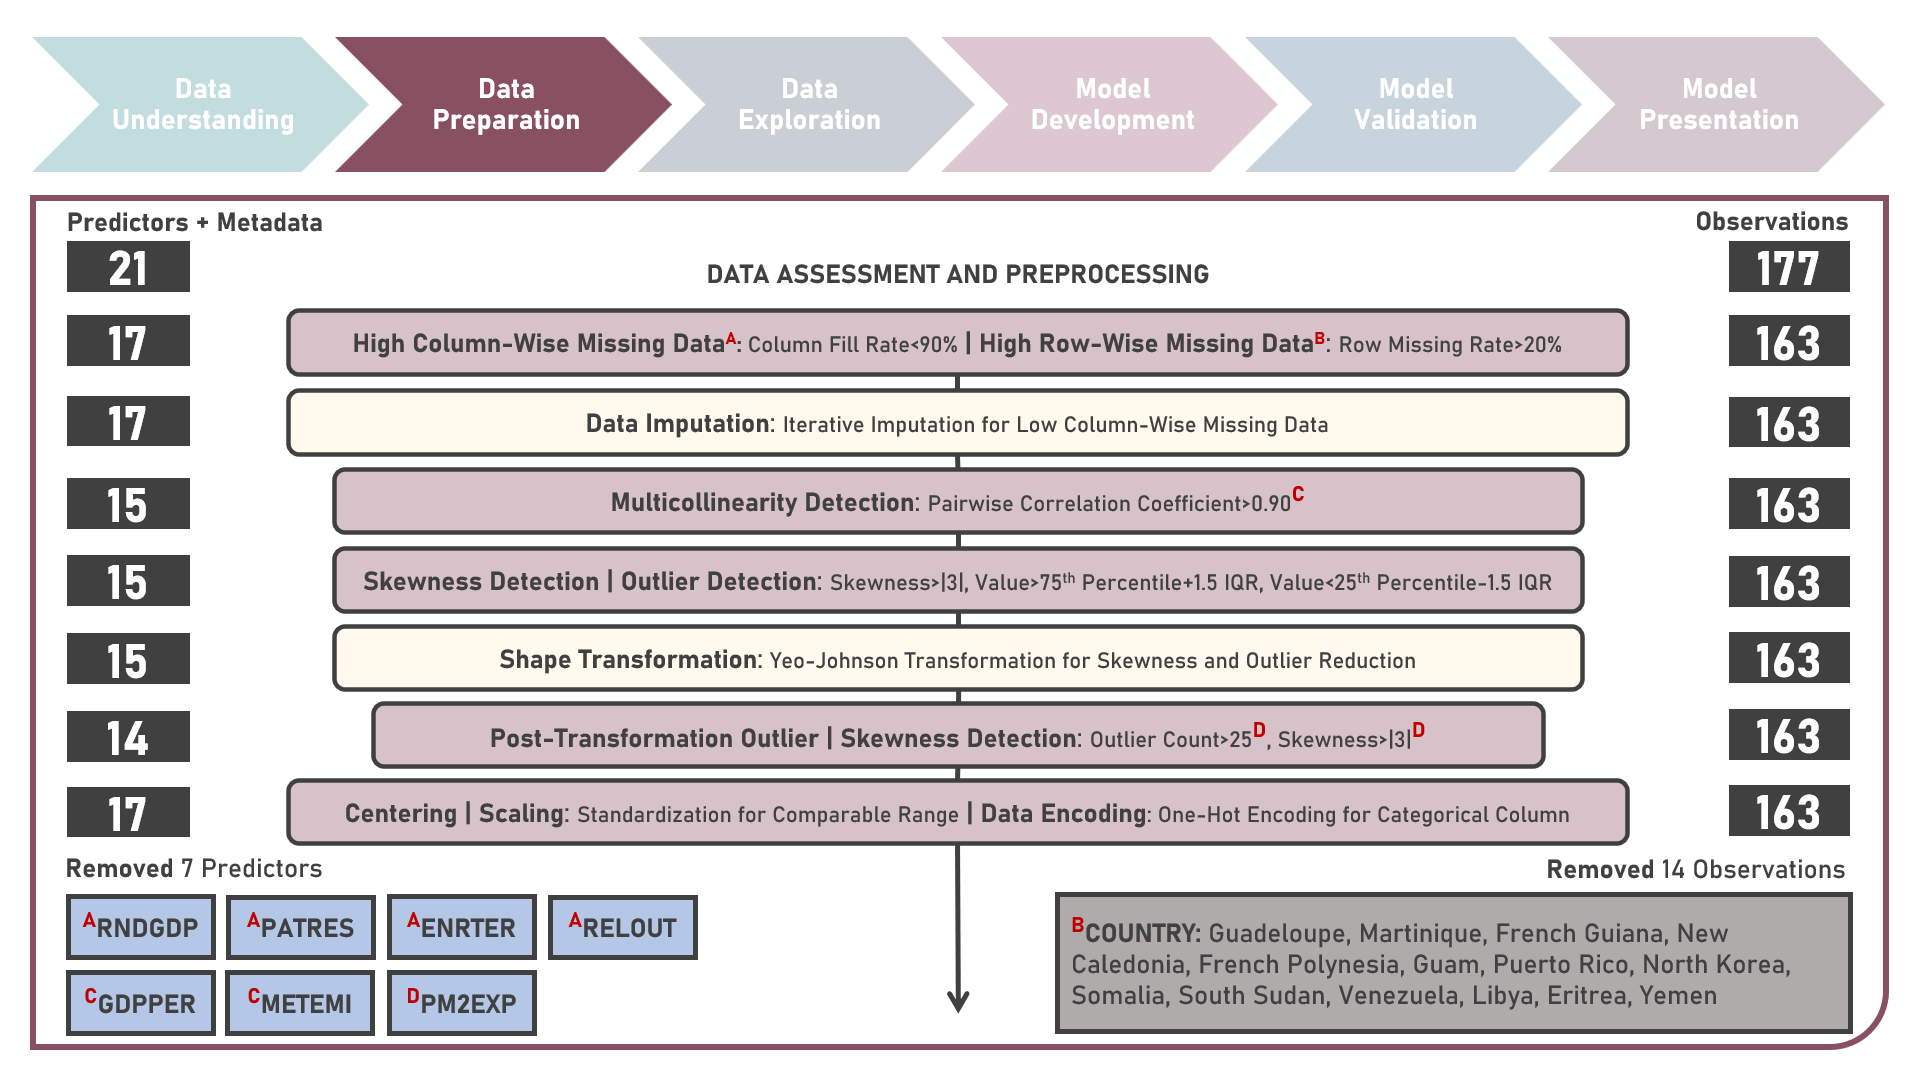
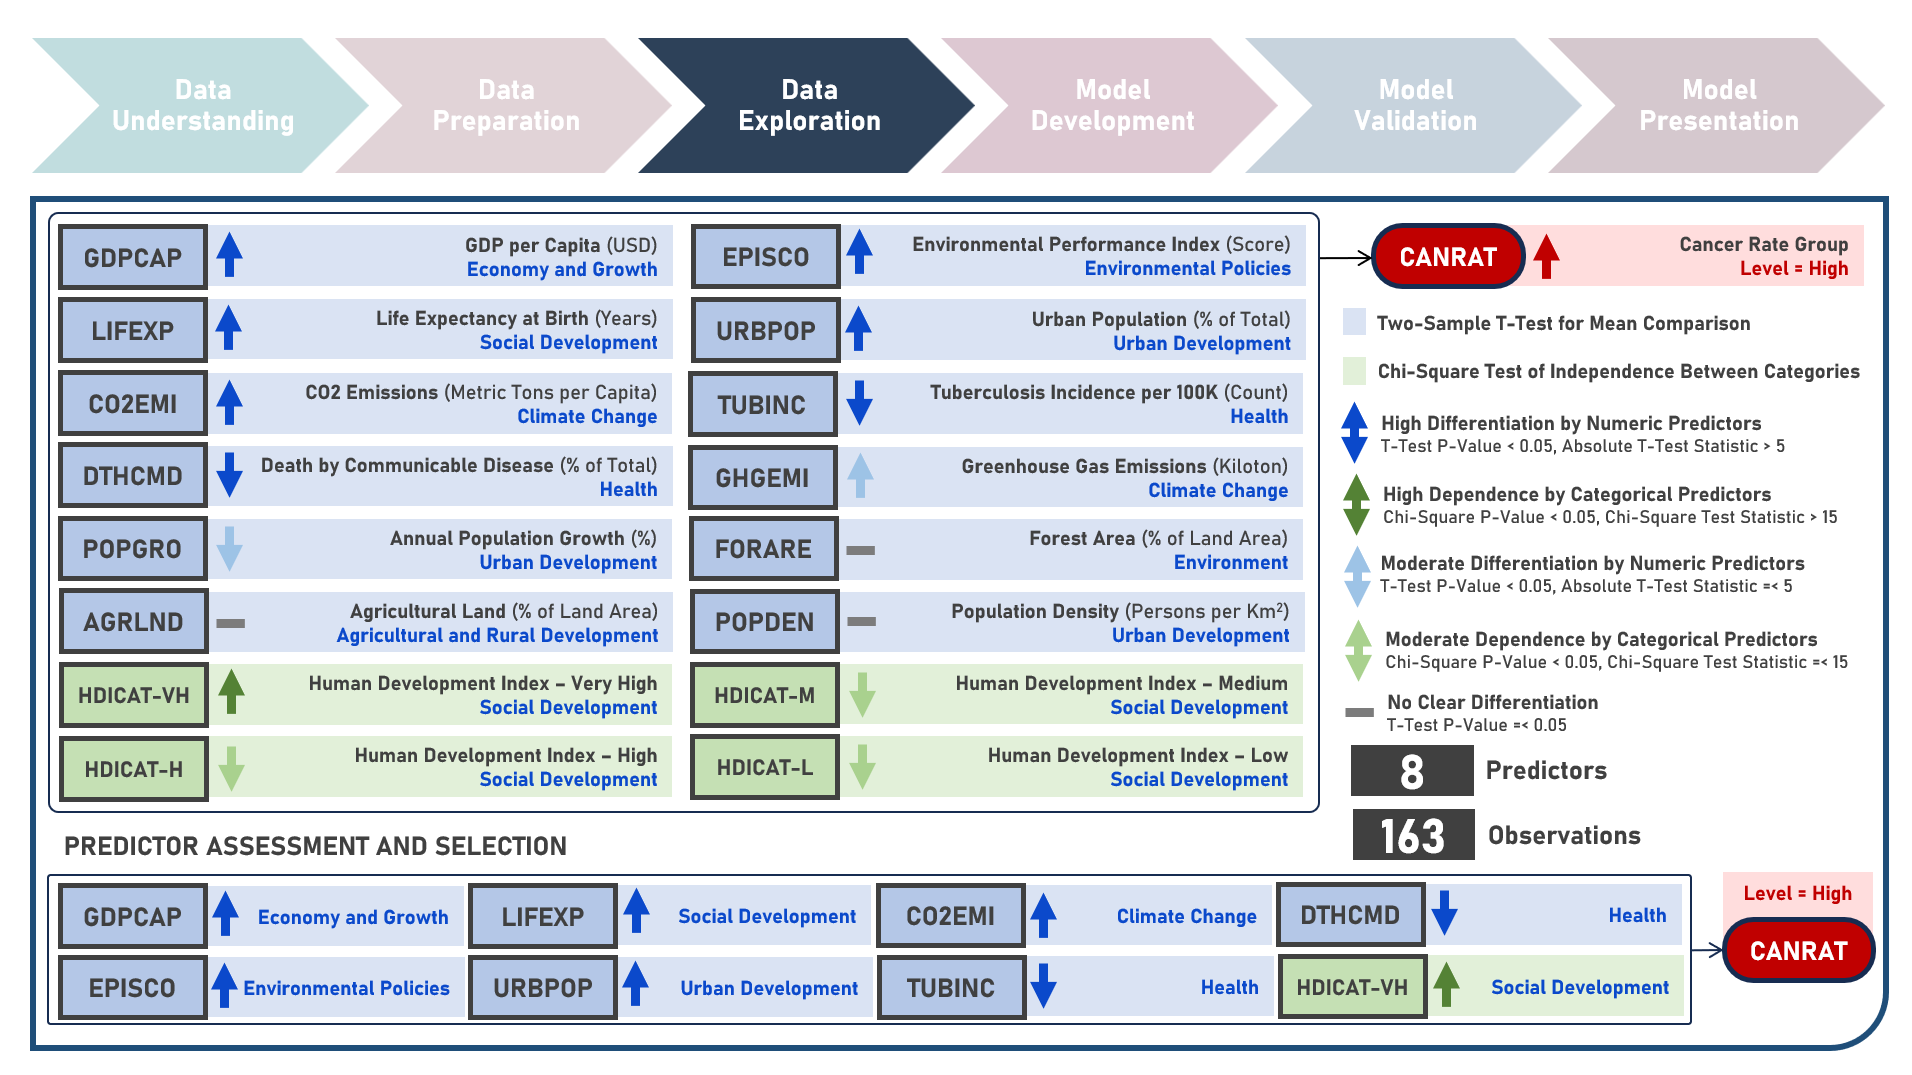
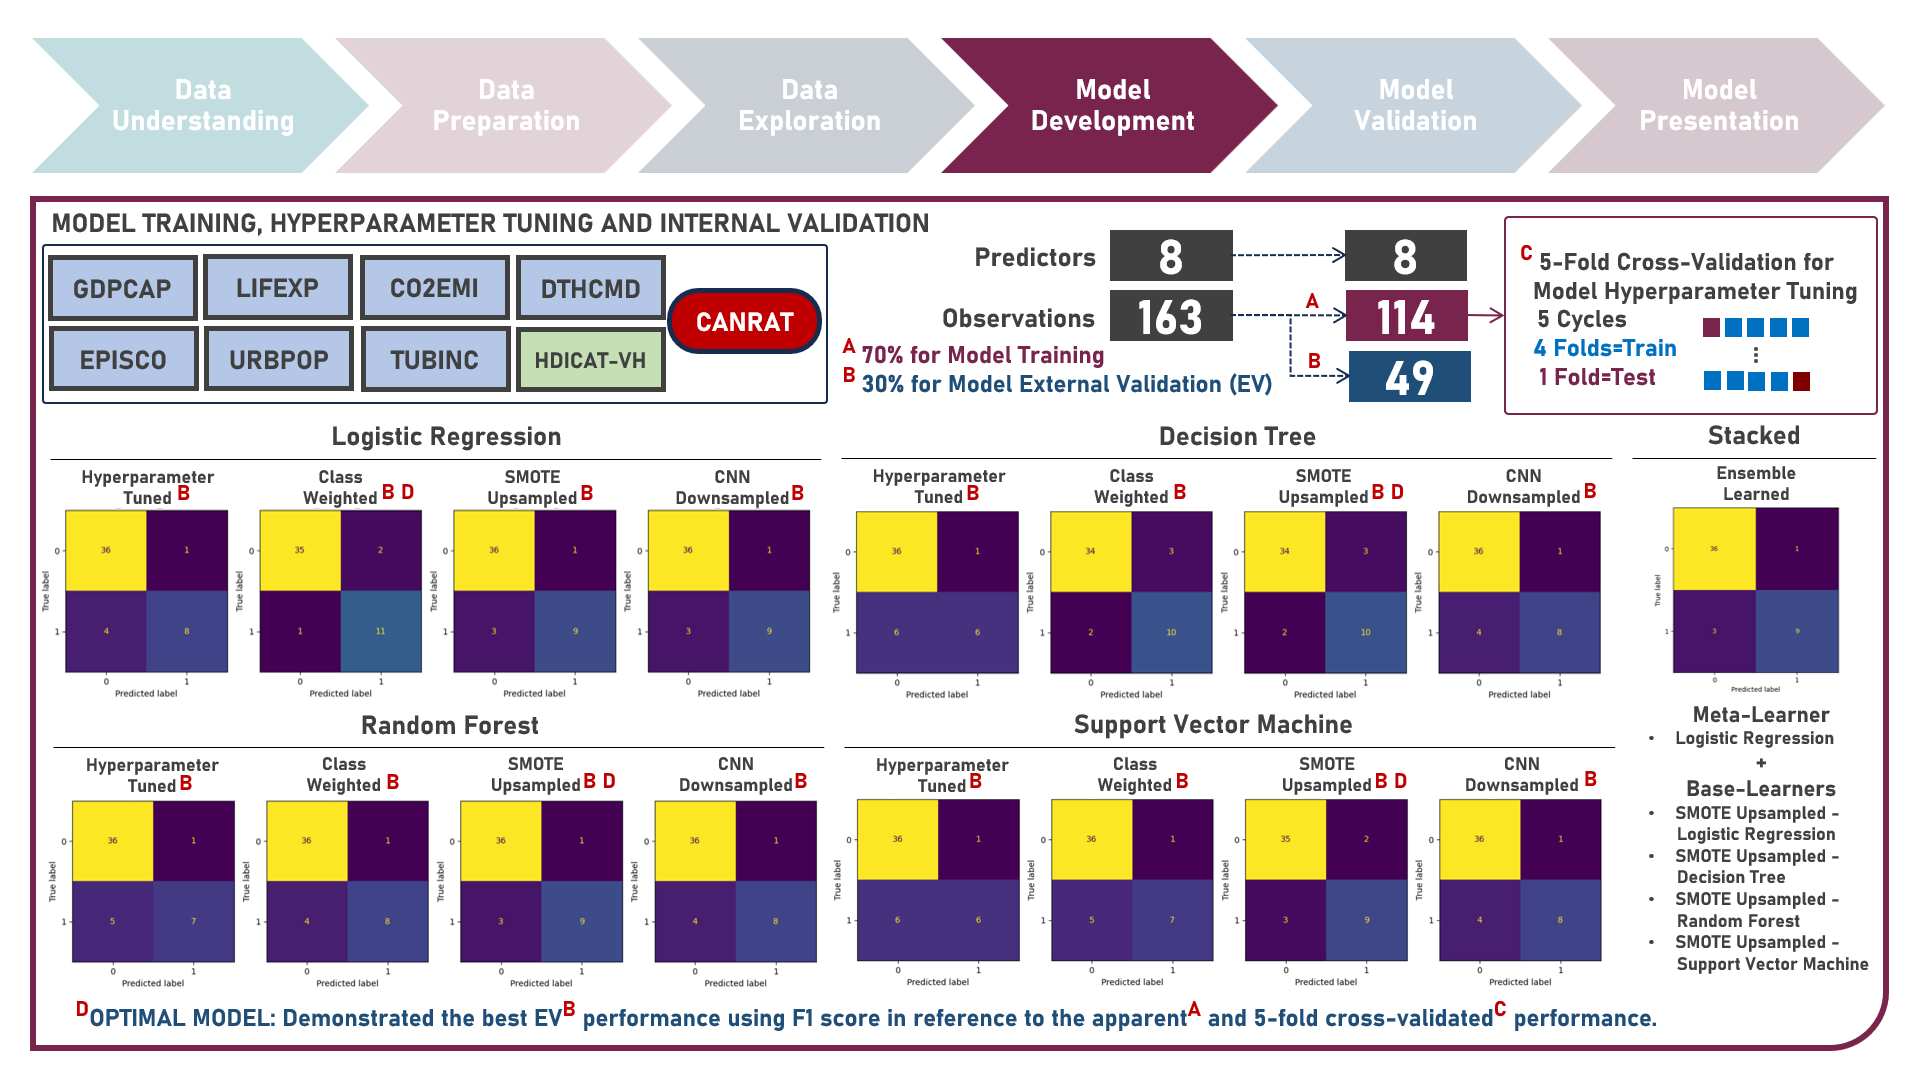
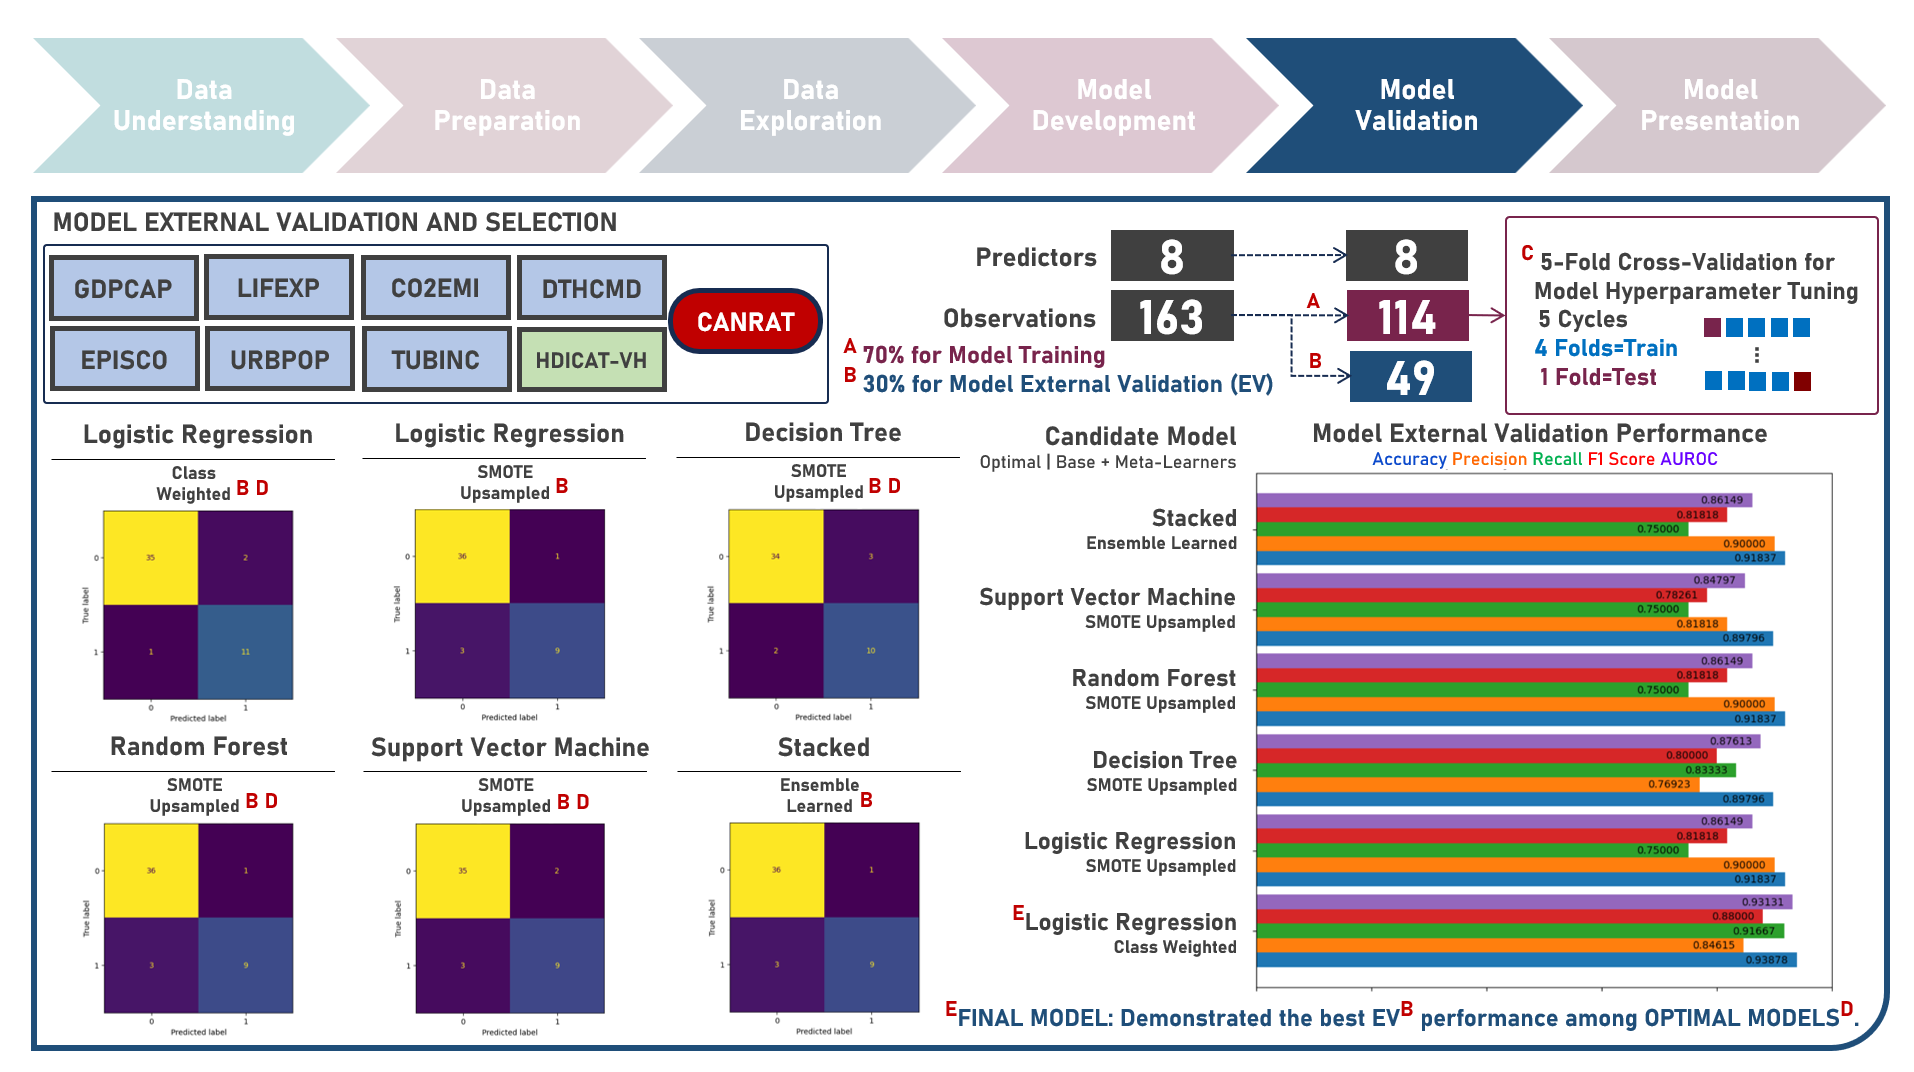
Supervised Learning : Identifying Contributing Factors for Countries With High Cancer Rates Using Classification Algorithms With Class Imbalance Treatment
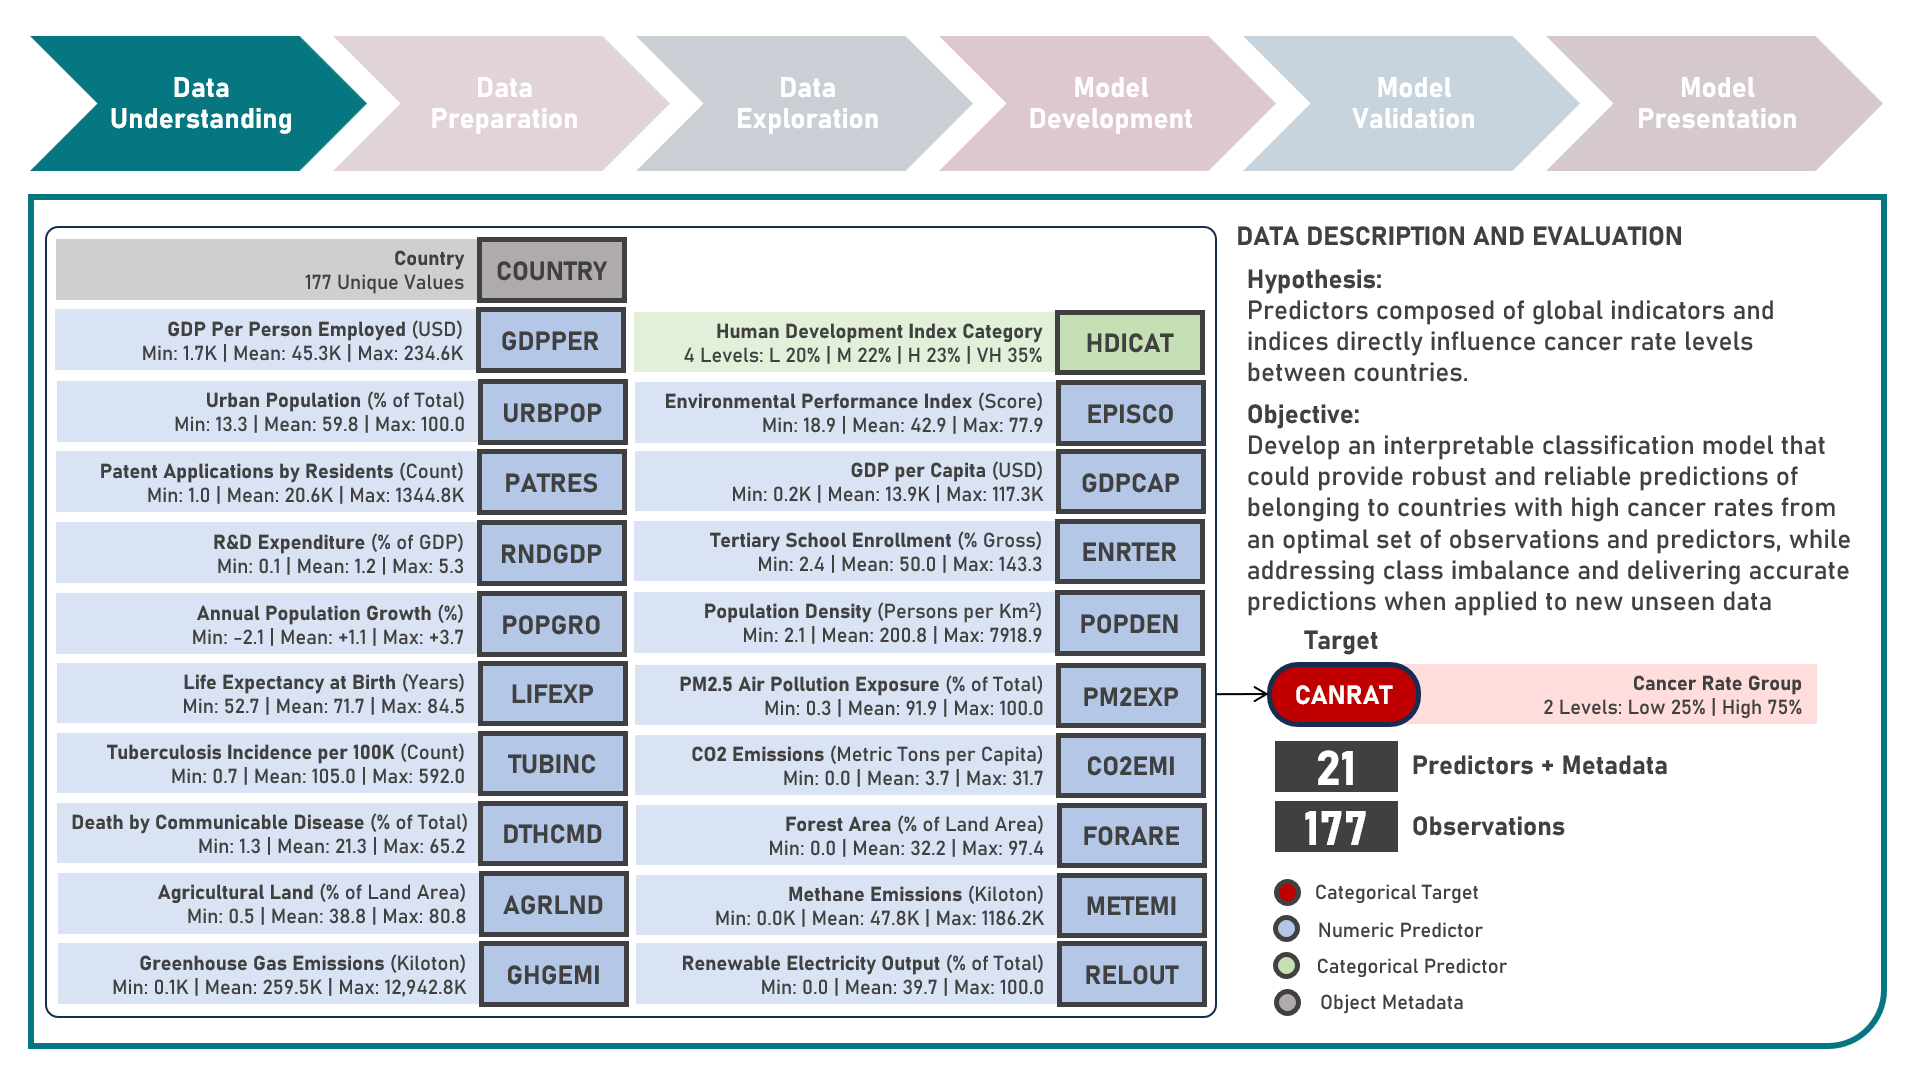
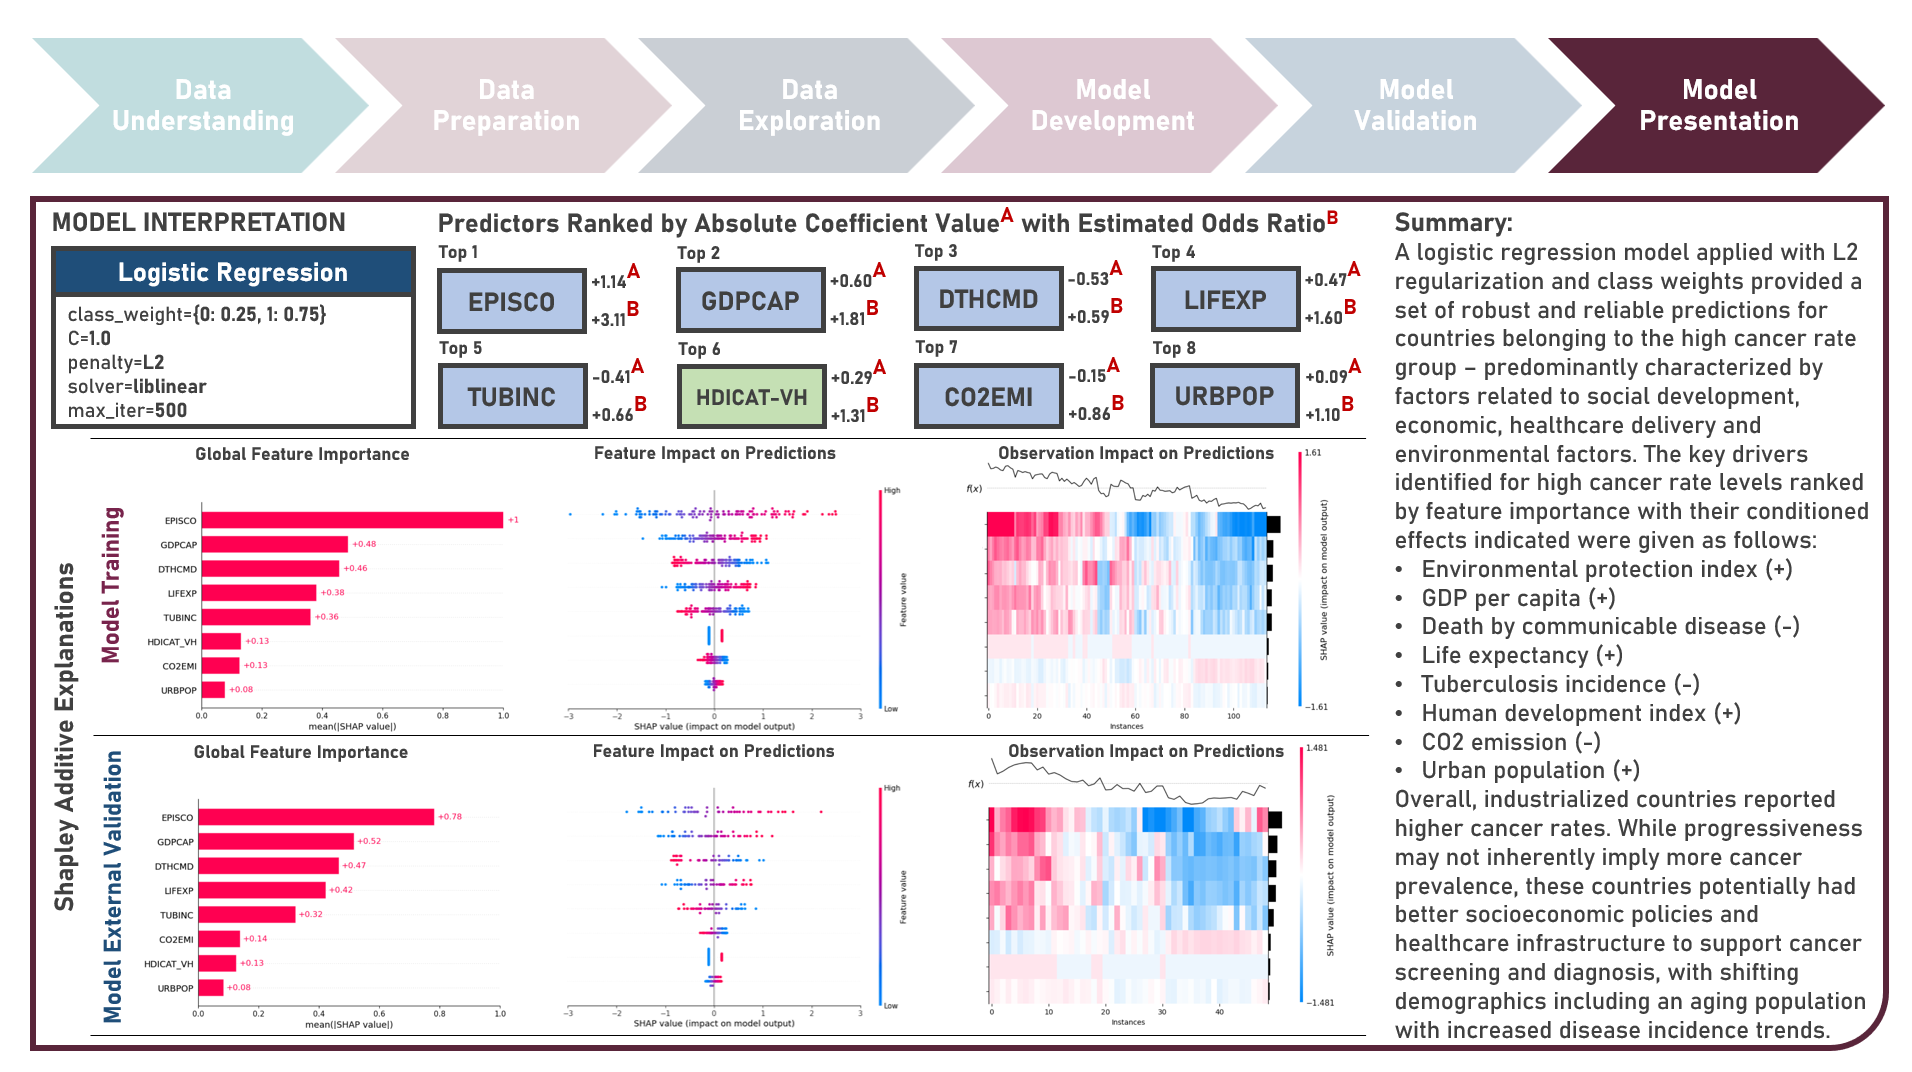
Age-standardized cancer rates are measures used to compare cancer incidence between countries while accounting for differences in age distribution. They allow for a more accurate assessment of the relative risk of cancer across populations with diverse demographic and socio-economic characteristics - enabling a more nuanced understanding of the global burden of cancer and facilitating evidence-based public health interventions. This case study aims to develop an interpretable classification model which could provide robust and reliable predictions of belonging to a group of countries with high cancer rates from an optimal set of observations and predictors, while addressing class imbalance and delivering accurate predictions when applied to new unseen data. Data quality assessment and model-independent feature selection were conducted on the initial dataset to identify and remove cases or variables noted with irregularities, in adddition to the subsequent preprocessing operations most suitable for the downstream analysis. Multiple classification modelling algorithms with various hyperparameter combinations were formulated using Logistic Regression, Decision Tree, Random Forest and Support Vector Machine. Class imbalance treatment including Class Weights, Upsampling with Synthetic Minority Oversampling Technique (SMOTE) and Downsampling with Condensed Nearest Neighbors (CNN) were implemented. Ensemble Learning Using Model Stacking was additionally explored. Model performance among candidate models was compared through the F1 Score which was used as the primary performance metric (among Accuracy, Precision, Recall and Area Under the Receiver Operating Characterisng Curve (AUROC) measures); evaluated internally (using K-Fold Cross Validation) and externally (using an Independent Test Set). Post-hoc exploration of the model results to provide insights on the importance, contribution and effect of the various predictors to model prediction involved model-specific (Odds Ratios) and model-agnostic (Shapley Additive Explanations) methods.

Unsupervised Learning : Uncovering Underlying Constructs of Chronic Disease Indicators Across US States Using Exploratory and Confirmatory Factor Analyses
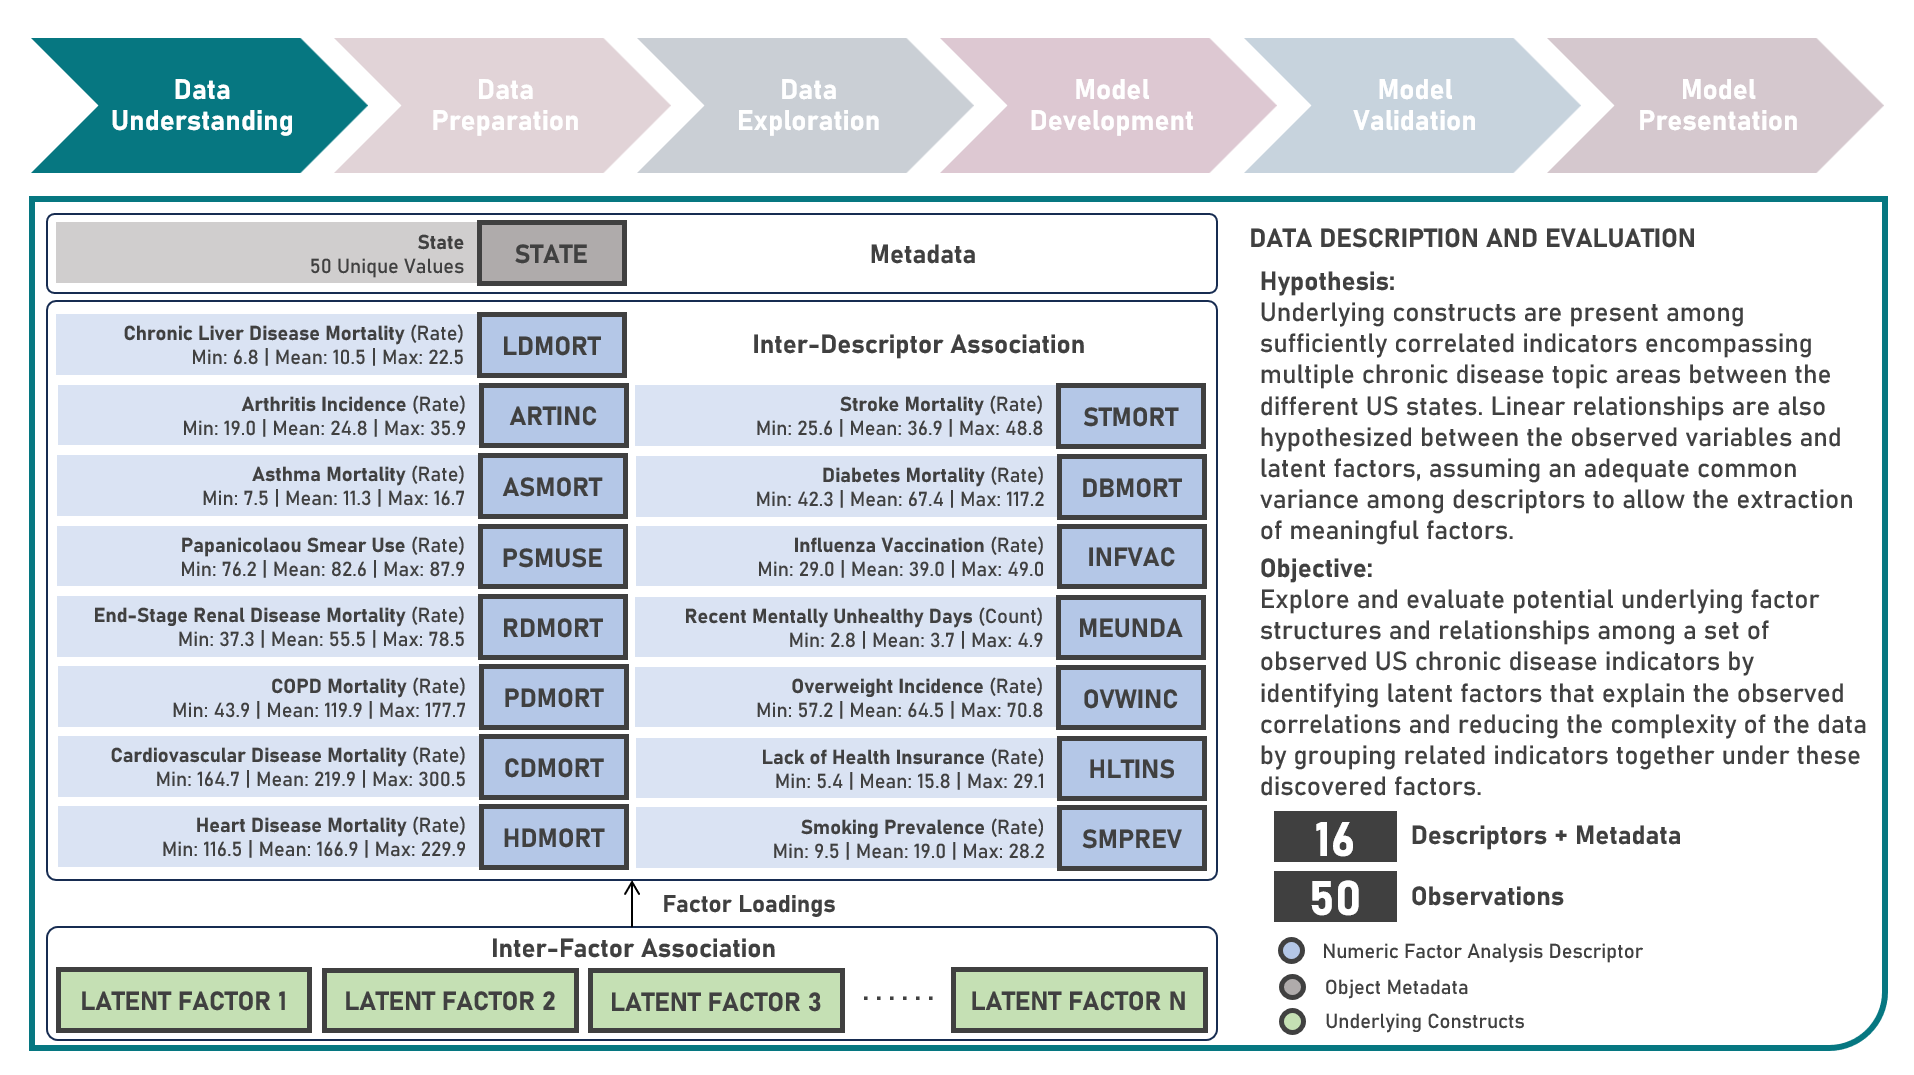
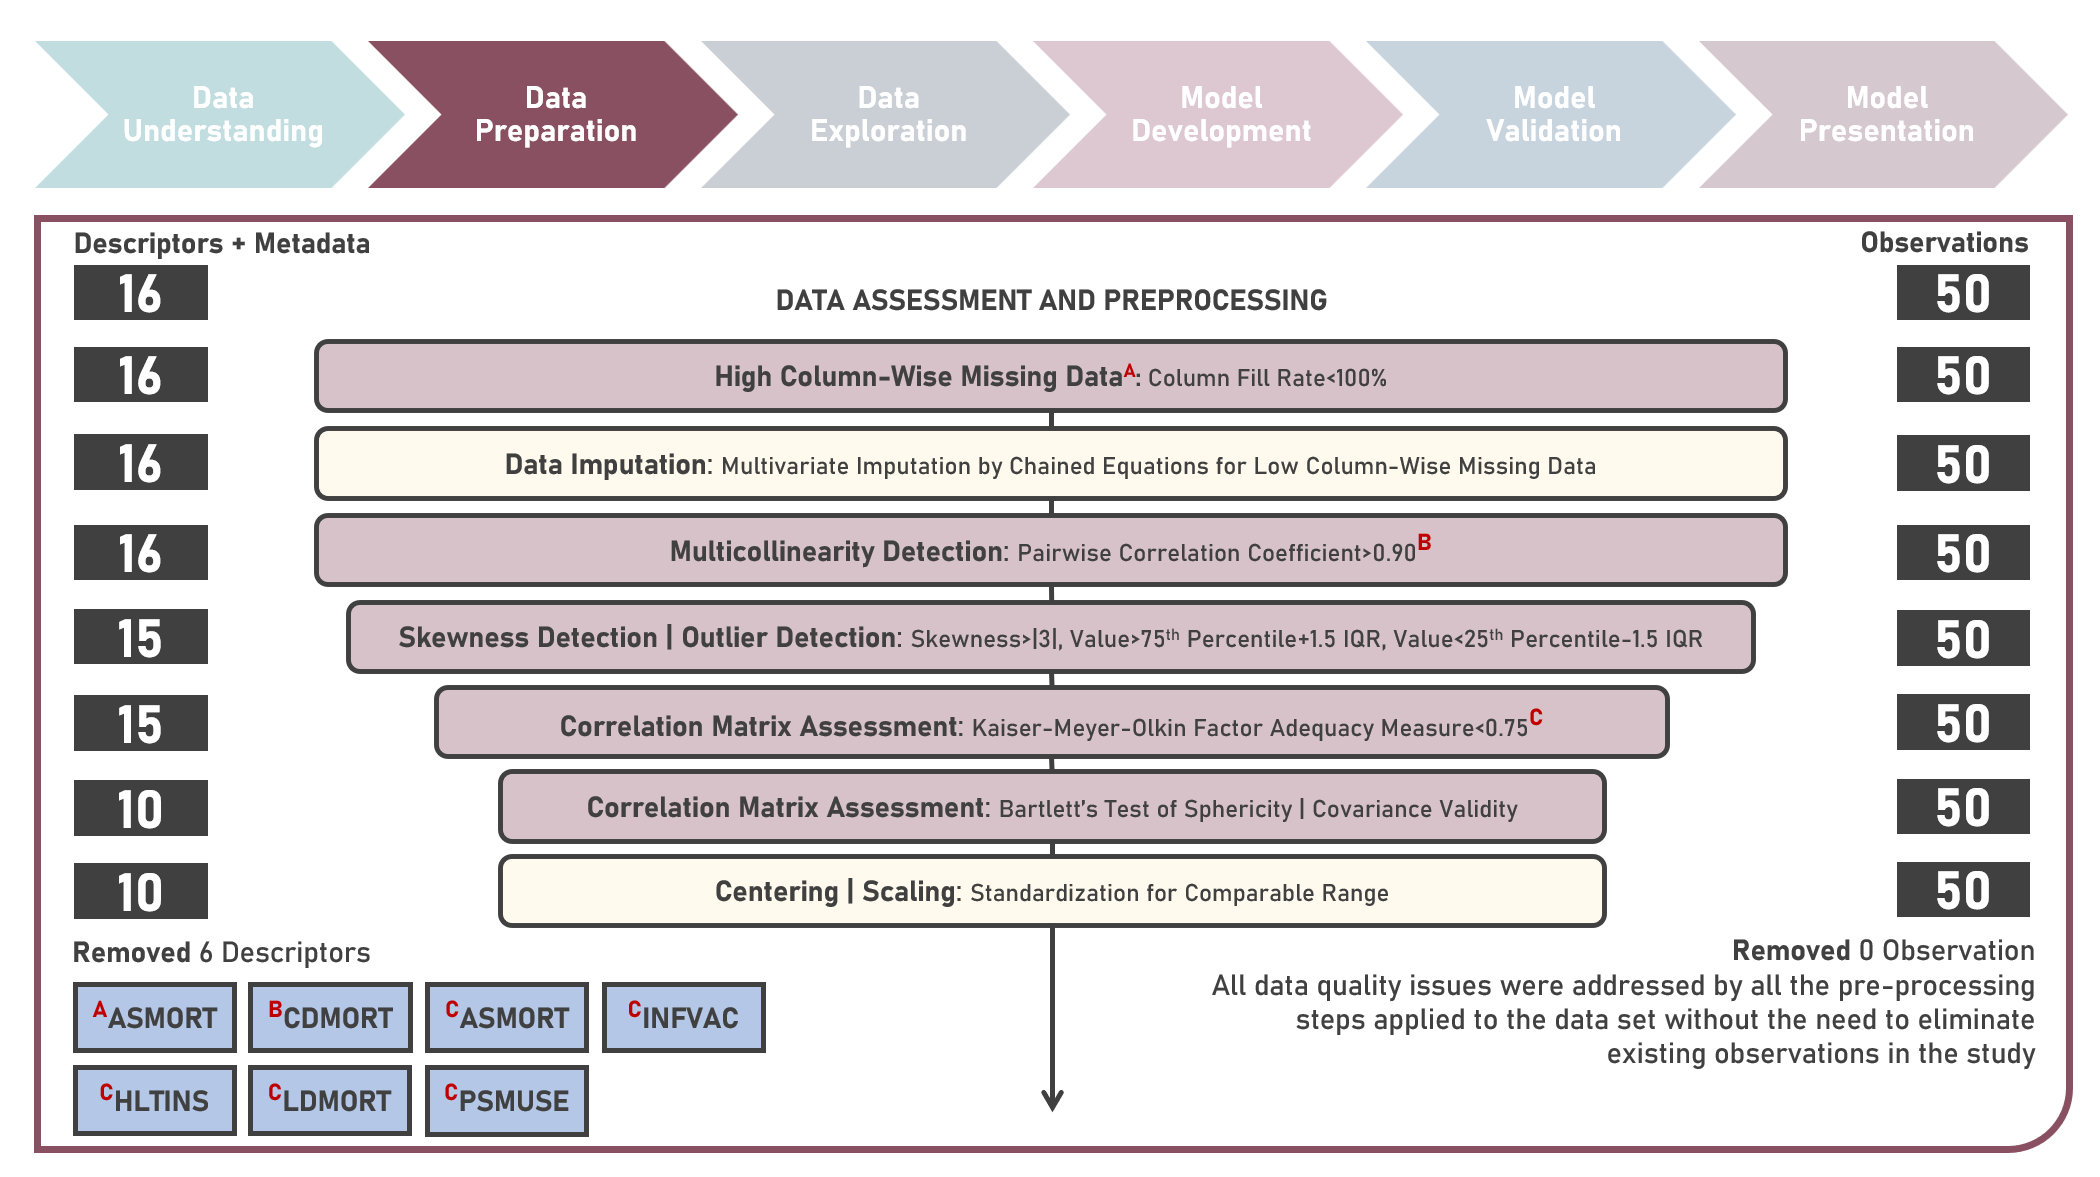
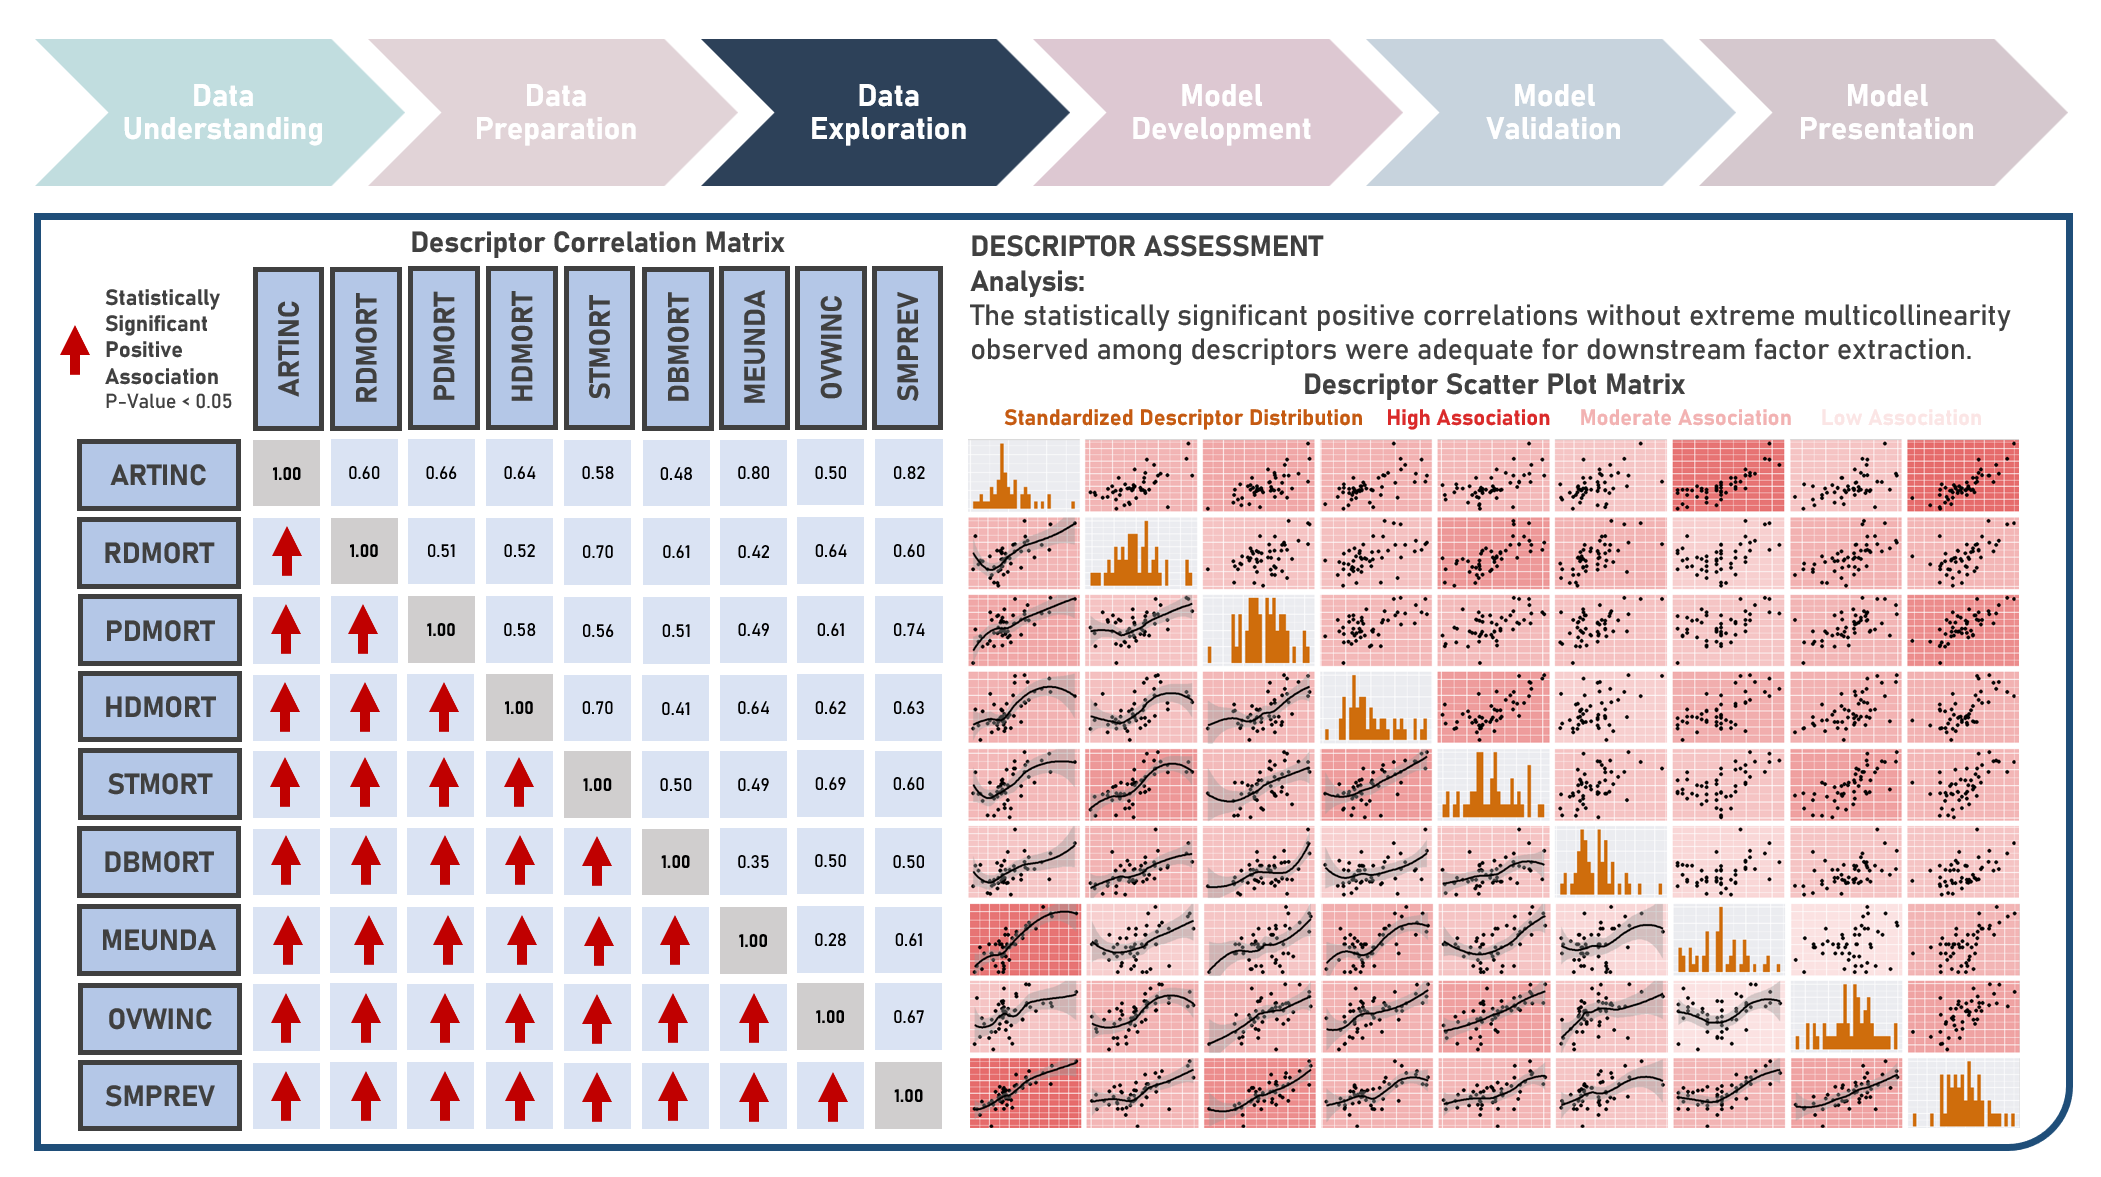
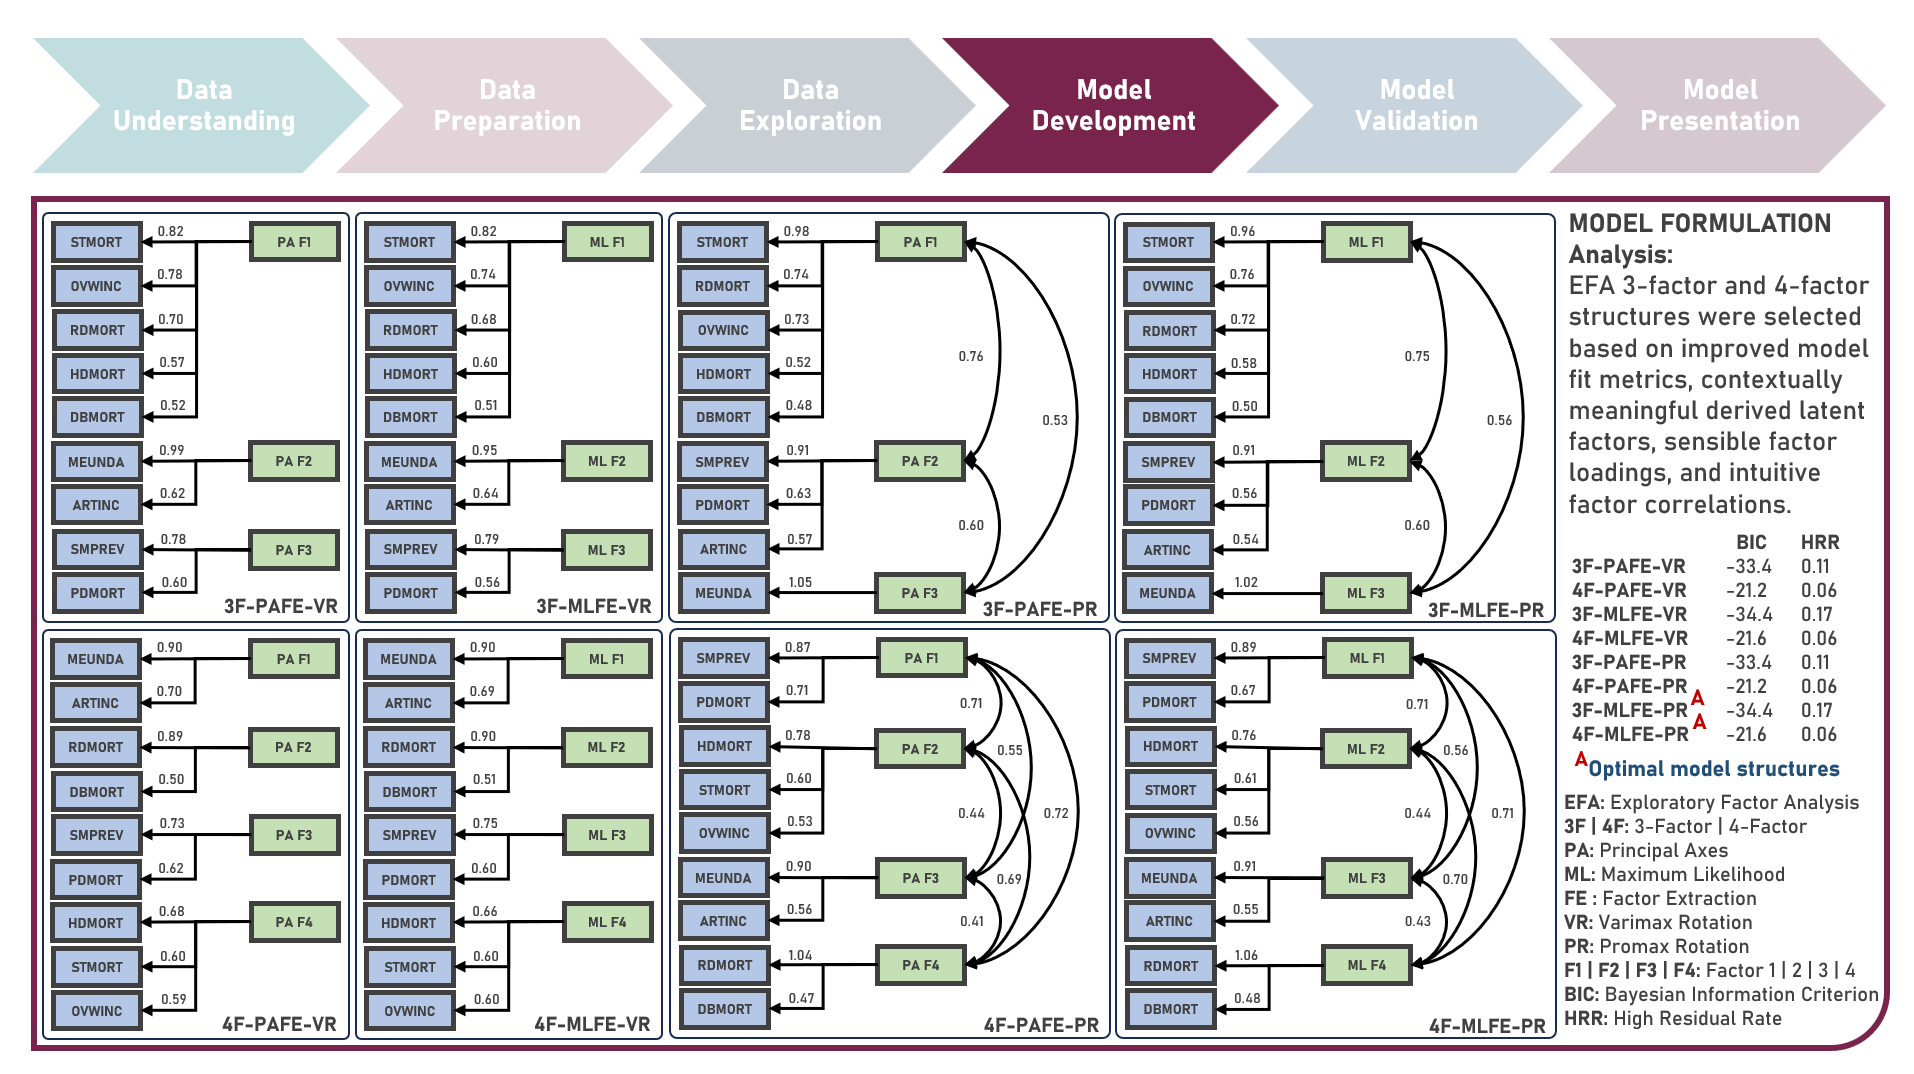
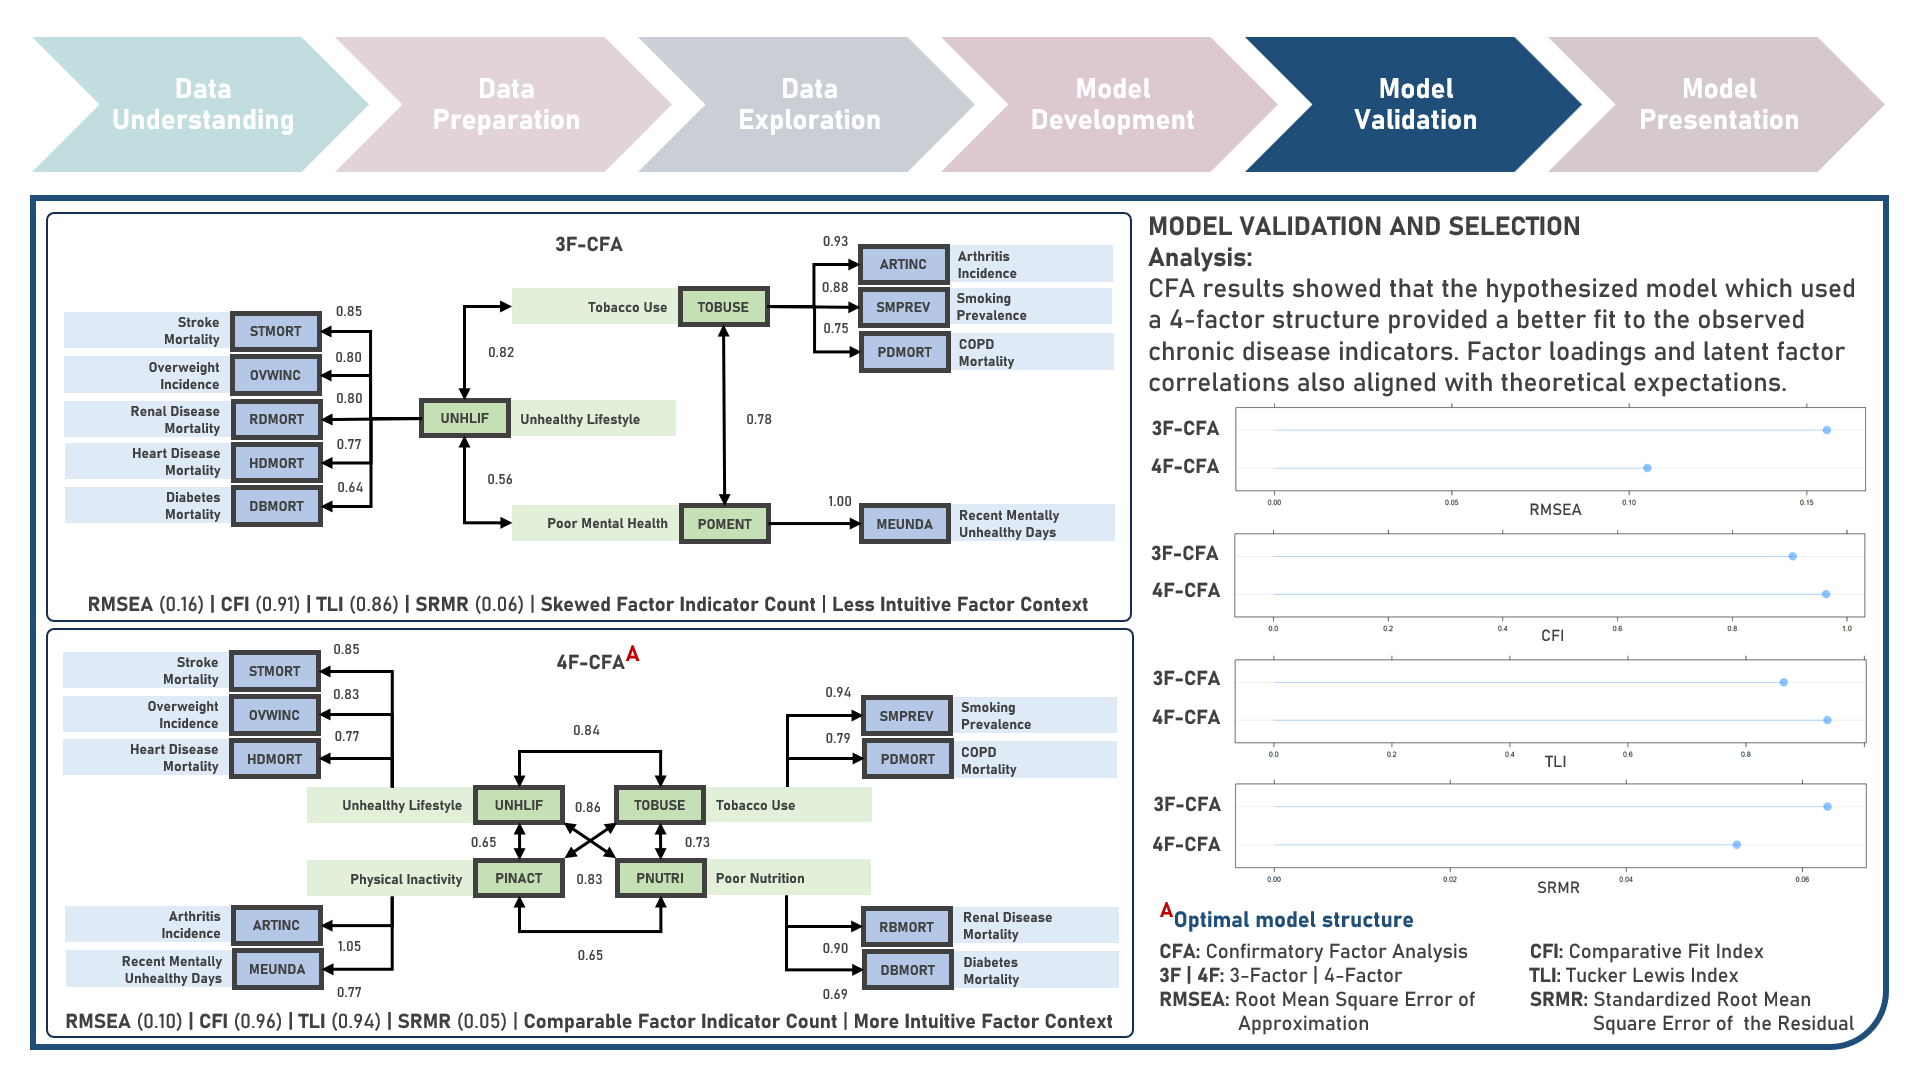
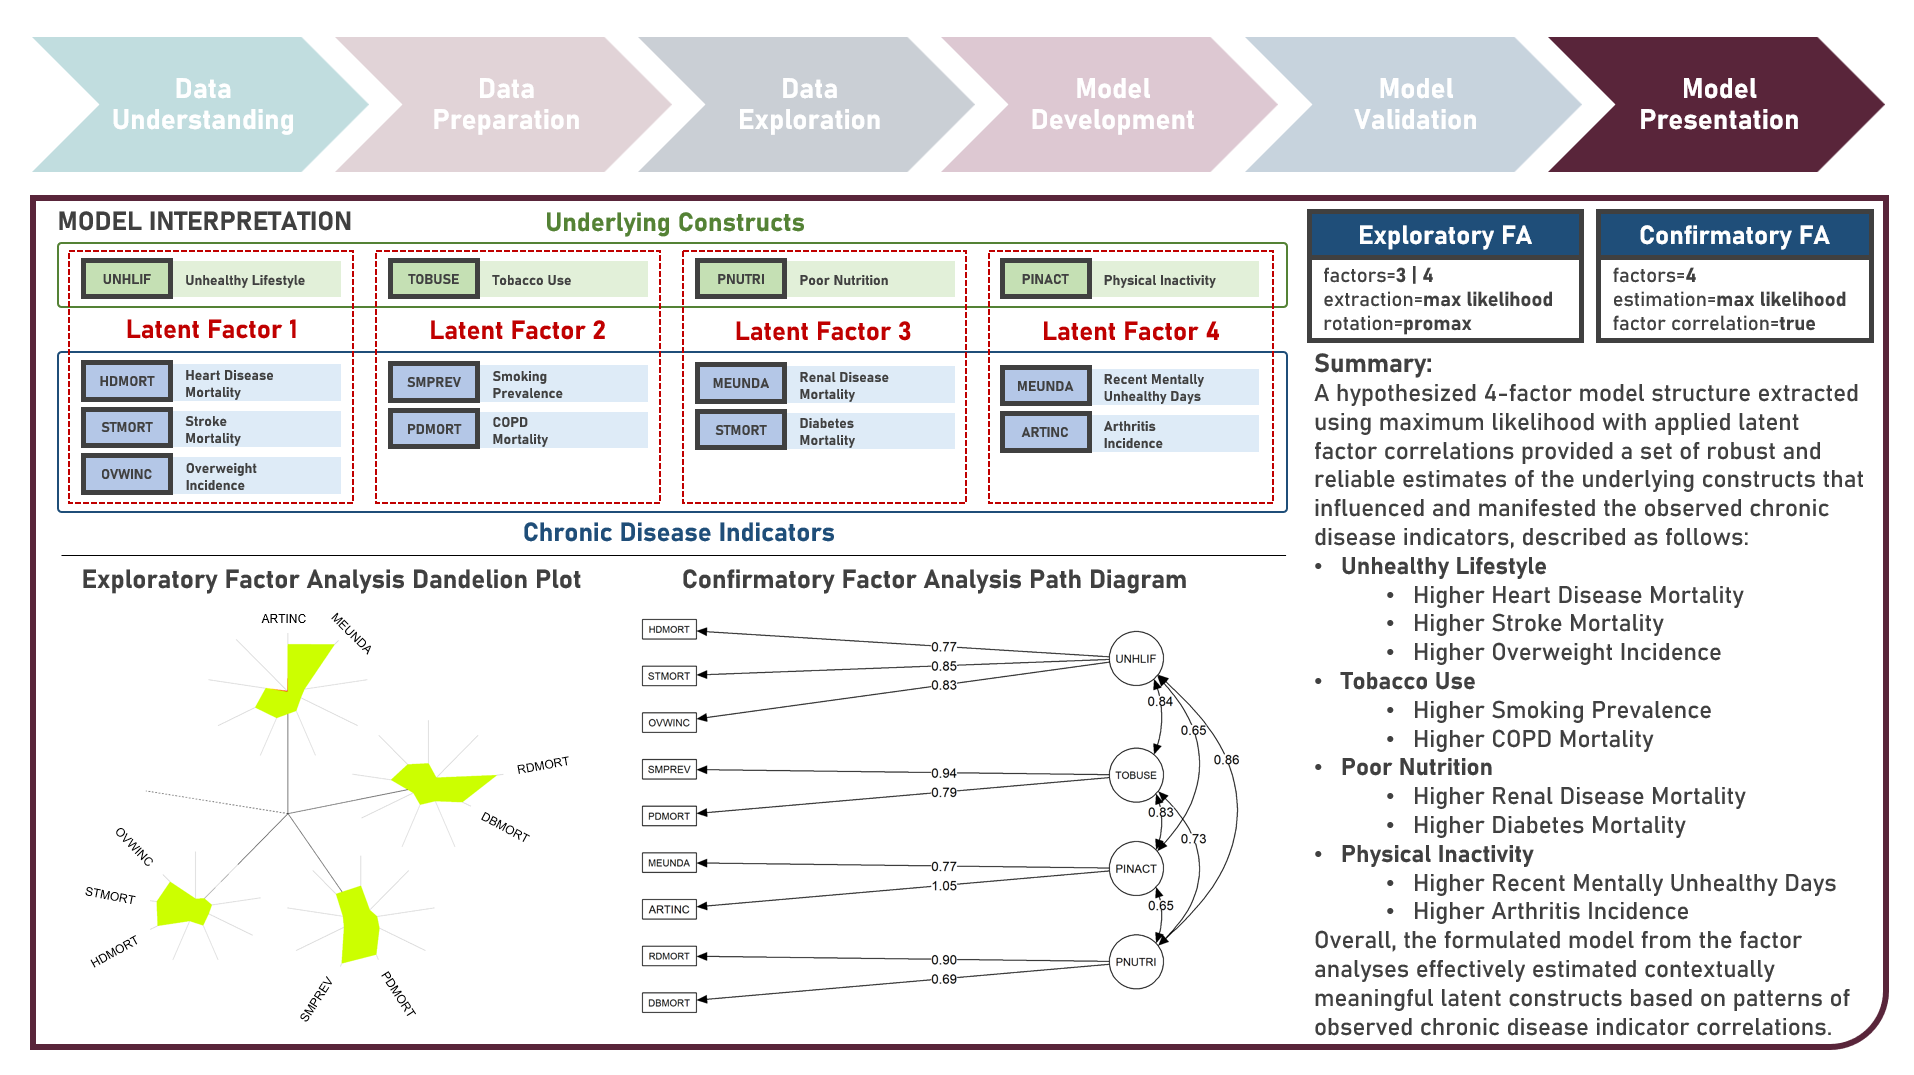
Chronic disease indicators are a set of surveillance indicators developed by consensus among the Center for Disease Controls and Prevention (CDC), Council of State and Territorial Epidemiologists (CSTE), and National Association of Chronic Disease Directors (NACDD). CDI enables public health professionals and policymakers to retrieve uniformly defined state-level data for chronic diseases and risk factors that have a substantial impact on public health. These indicators are essential for surveillance, prioritization, and evaluation of public health interventions. This case study aims to explore and validate potential underlying factor structures and relationships among a set of observed US chronic disease indicators by identifying latent factors that explain the observed correlations and reducing the complexity of the data by grouping related indicators together under these discovered factors. Data quality evaluation and correlation adequacy assessment were conducted on the initial dataset to identify and remove cases or variables noted with irregularities, in addition to the subsequent preprocessing operations most suitable for the downstream analysis. Multiple Exploratory Factor Analysis (EFA) model structures with various parameter combinations were formulated considering different Factor Extraction and Factor Rotation methods. The best models were determined using the Bayesian Information Criterion (BIC) and High Residual Rate performance metrics. All candidate models were additionally compared based on the contexts presented by the derived latent factors including their loadings and correlations. Confirmatory Factor Analysis (CFA) was conducted to validate the hypothesized factor model structures applying the Root Mean Square Error of Approximation (RMSEA), Comparative Fit Index (CFI), Tucker Lewis Index (TLI), and Standardized Root Mean Square Error of the Residual (SRMR) performance metrics. In addition to assessing the model fit, alignment of the factor loadings and latent factor correlations with theoretical expectations was evaluated. Post-hoc exploration of the model results to provide insights on the importance, contribution, and effect of the various underlying constructs to the observed indicators involved EFA Dandelion Plot and CFA Path Diagram methods.

Supervised Learning : Characterizing Life Expectancy Drivers Across Countries Using Model-Agnostic Interpretation Methods for Black-Box Models
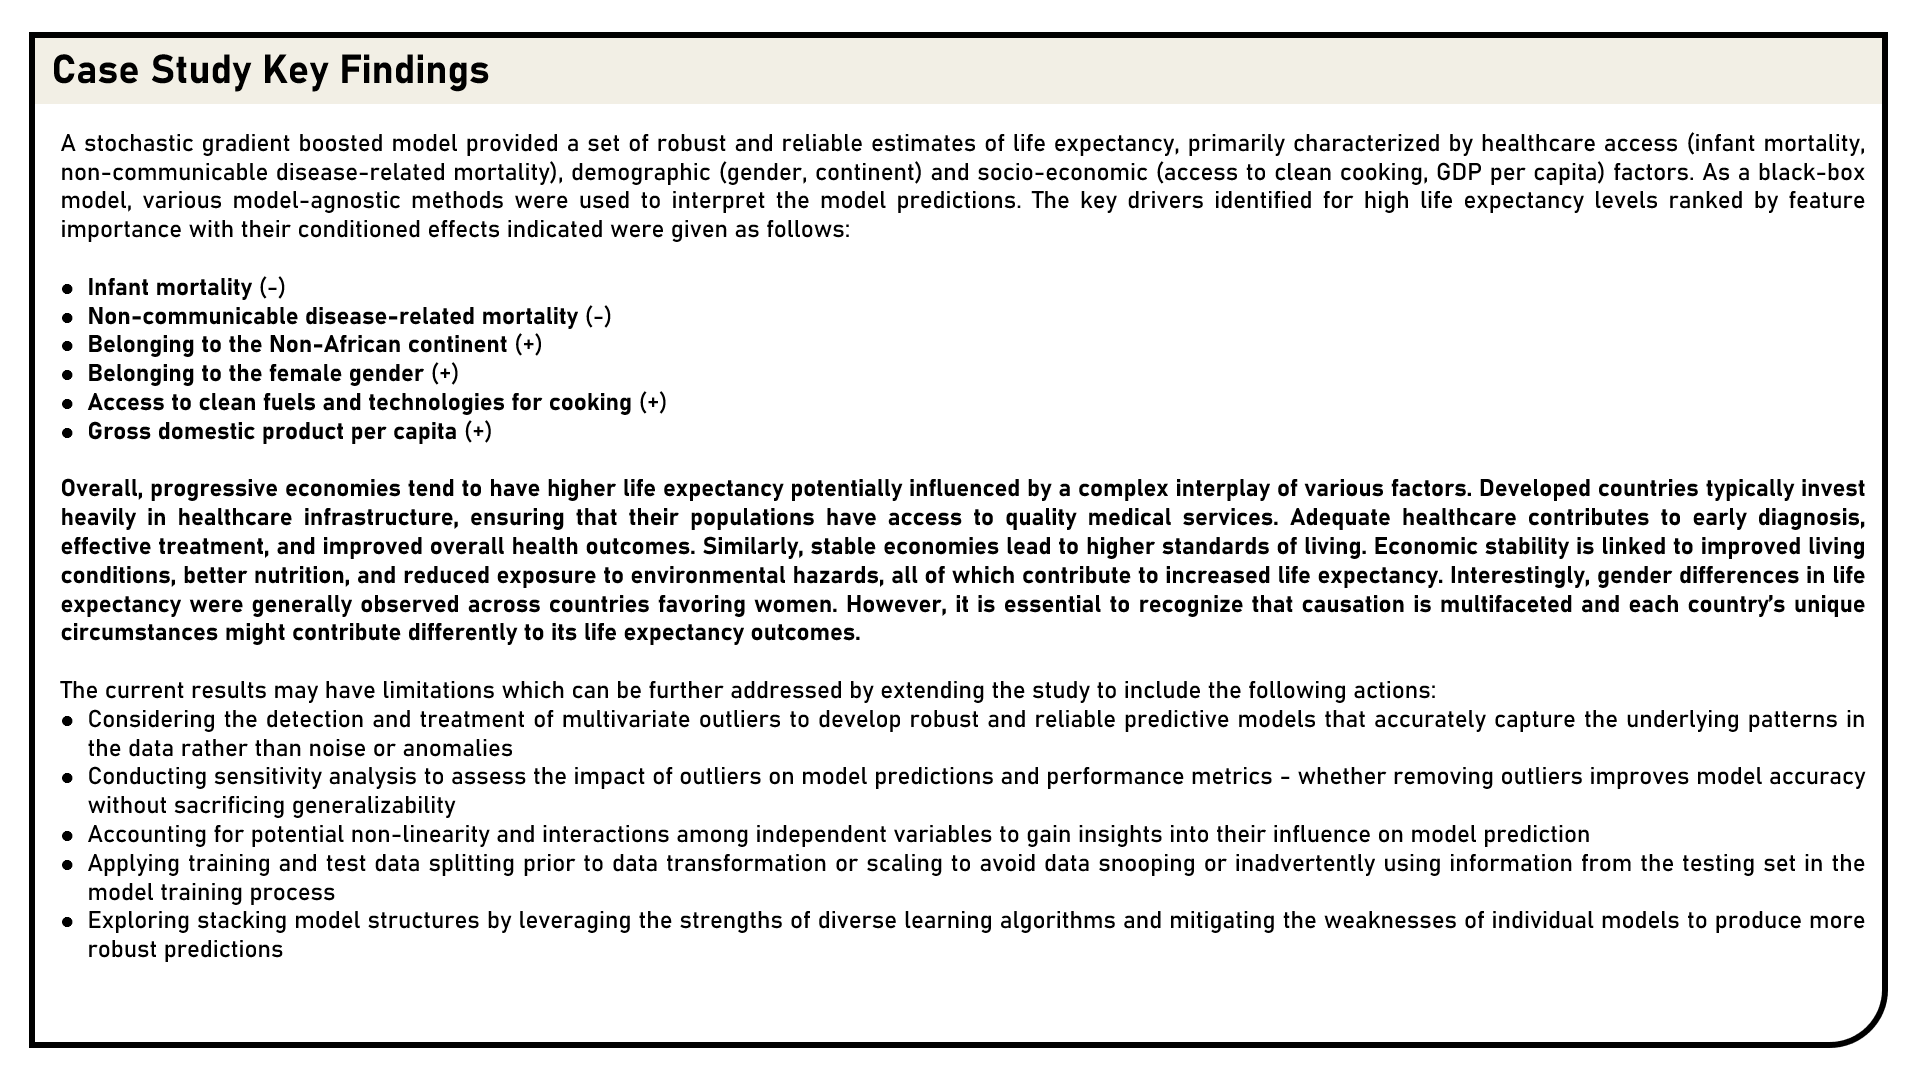
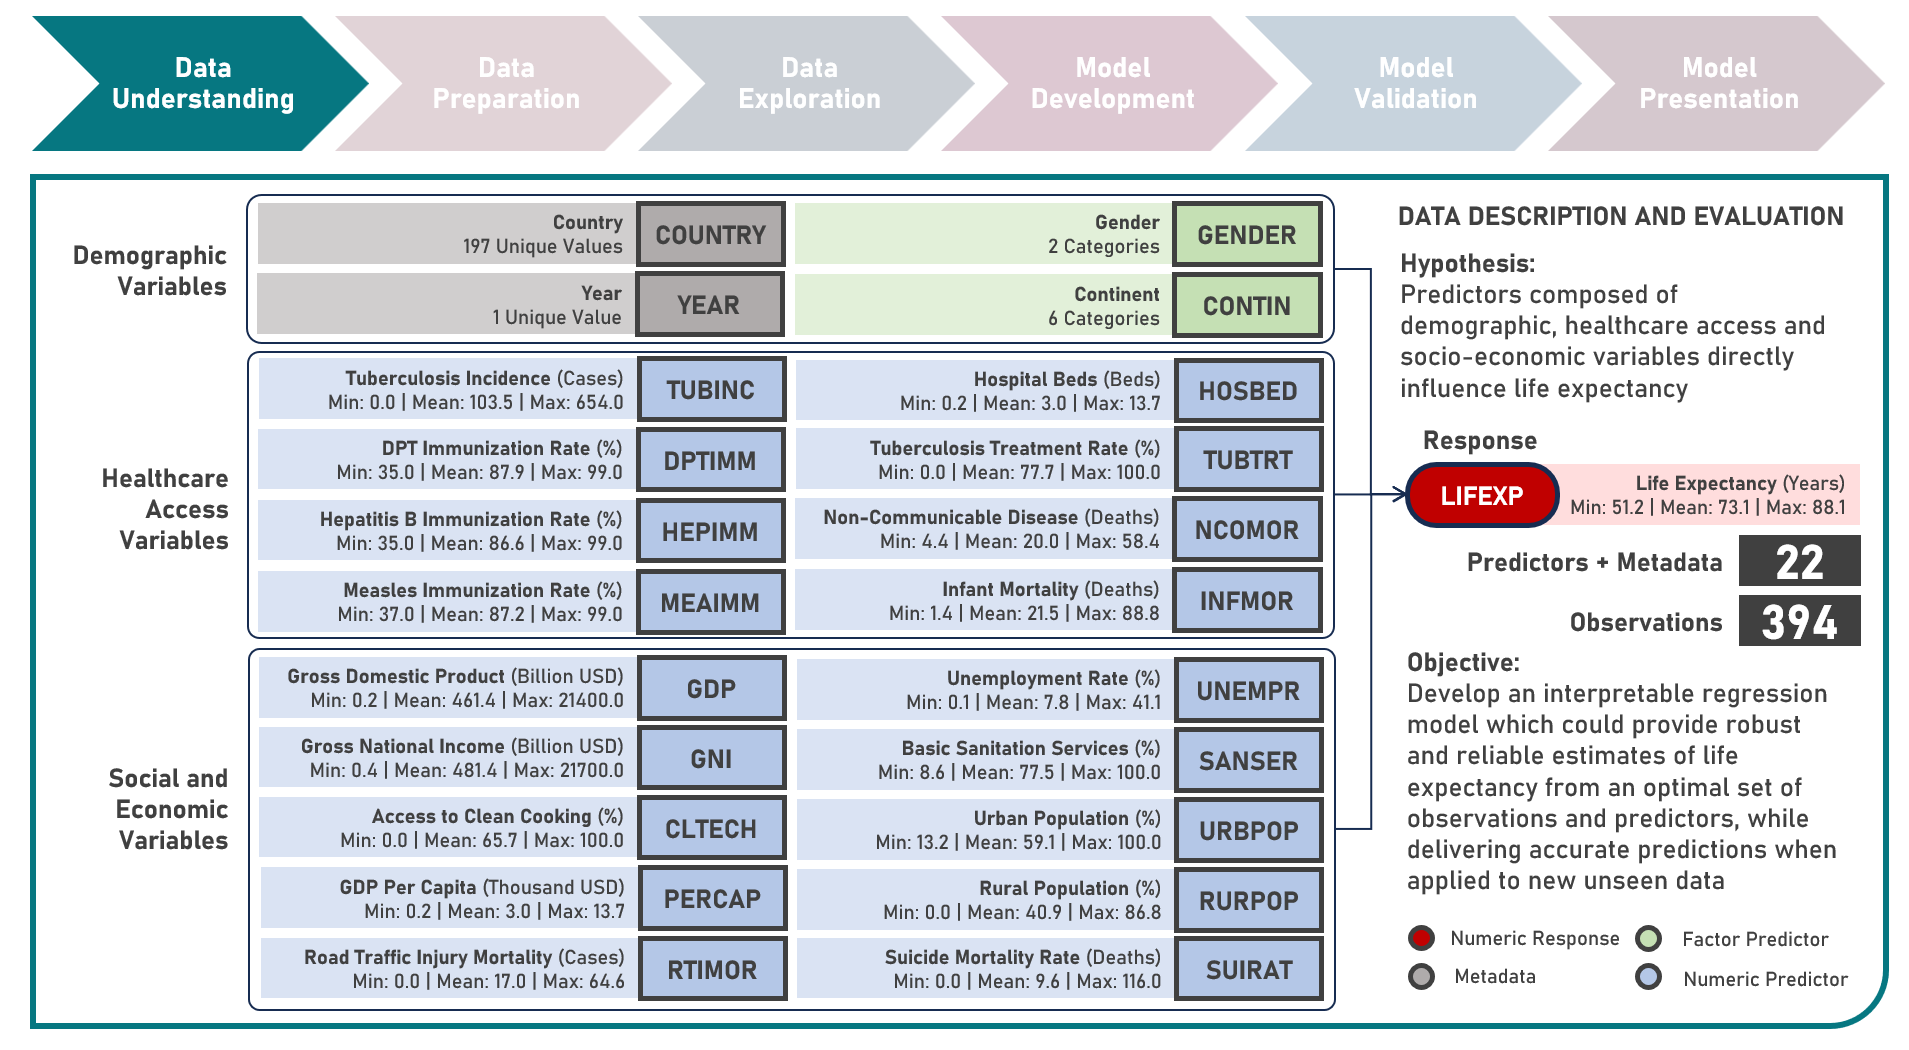
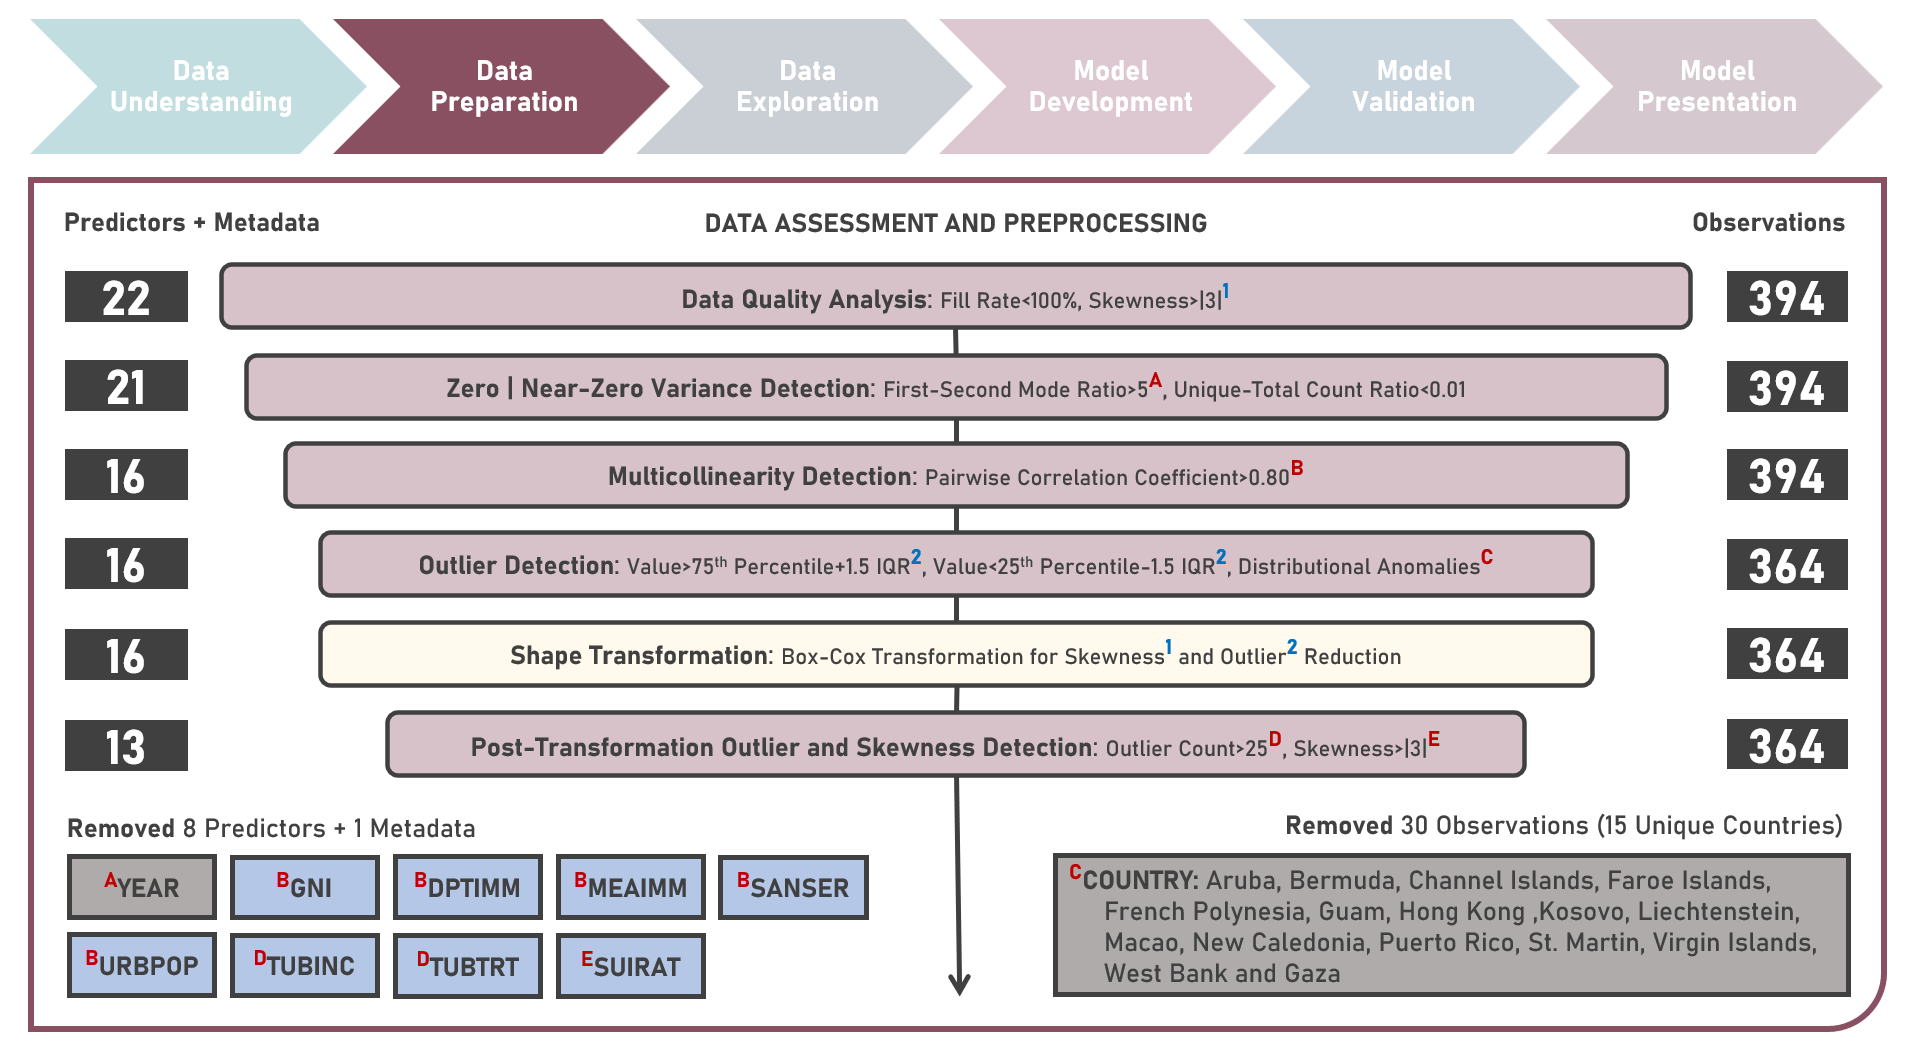
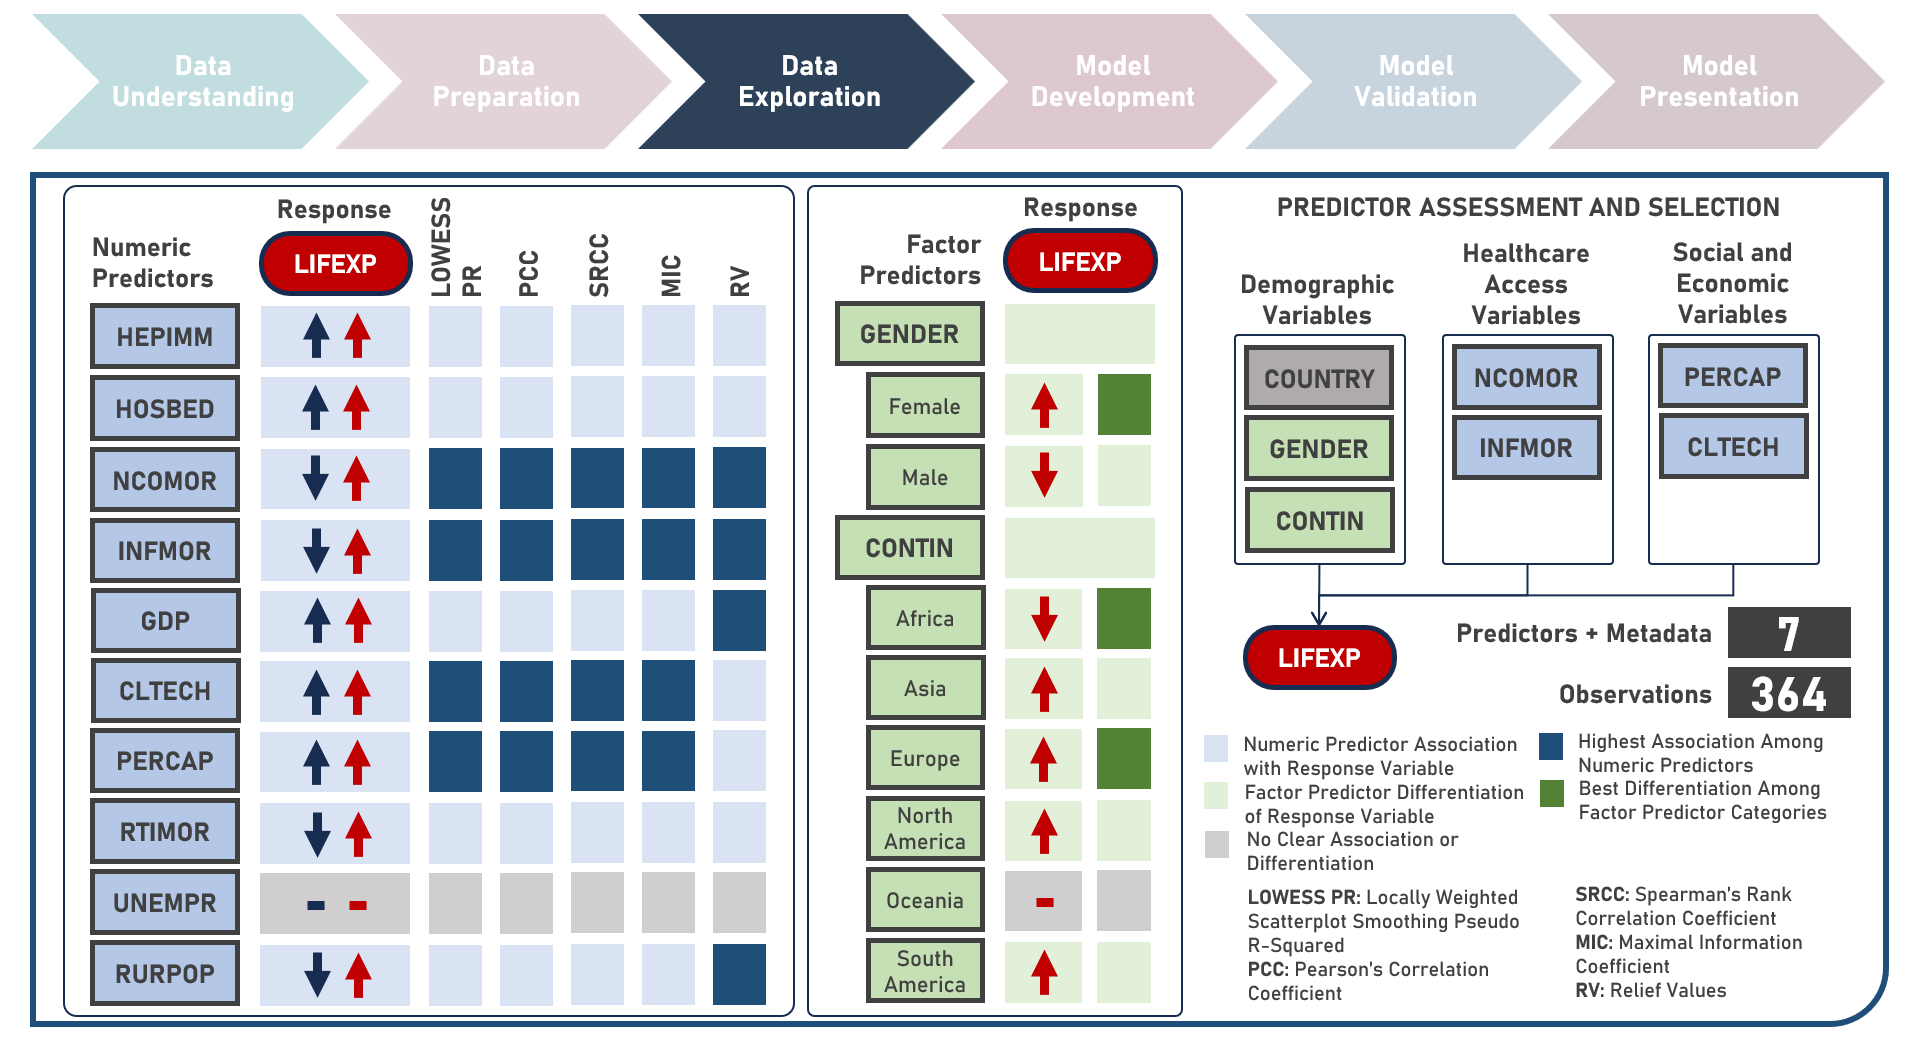
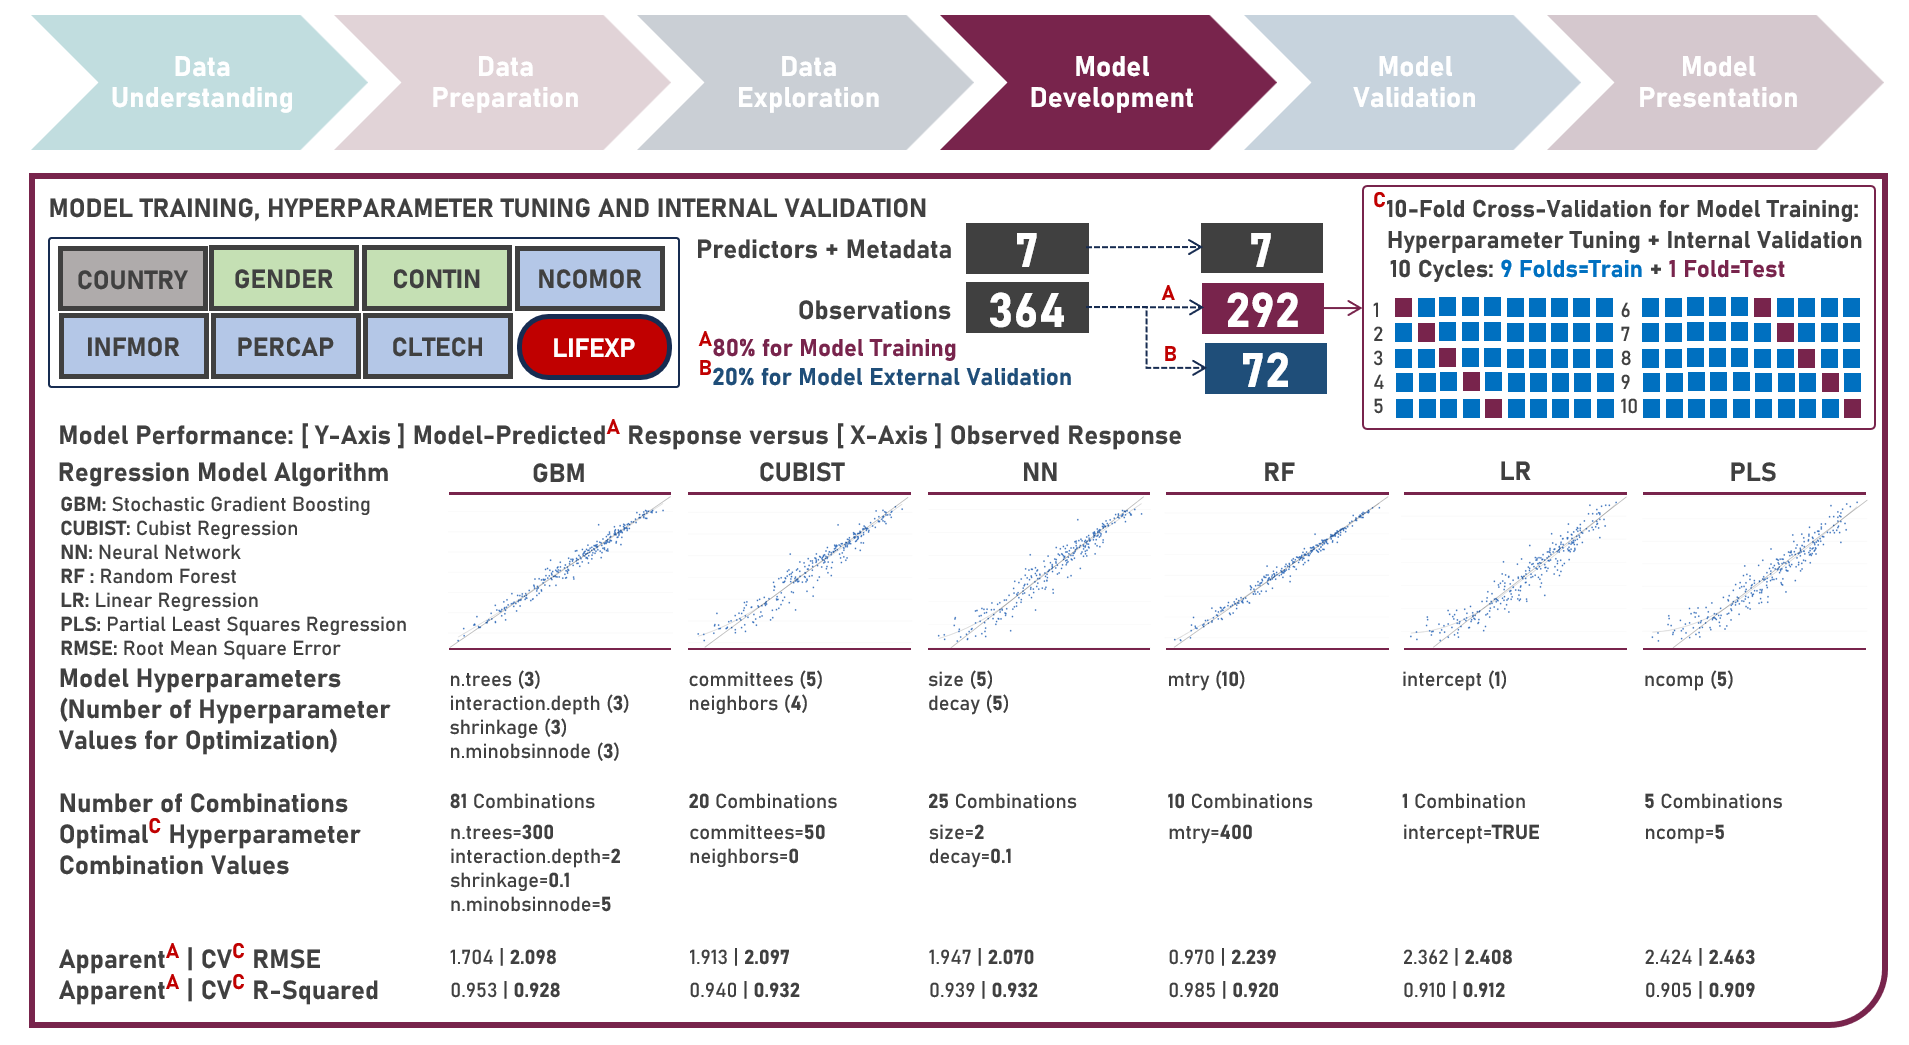
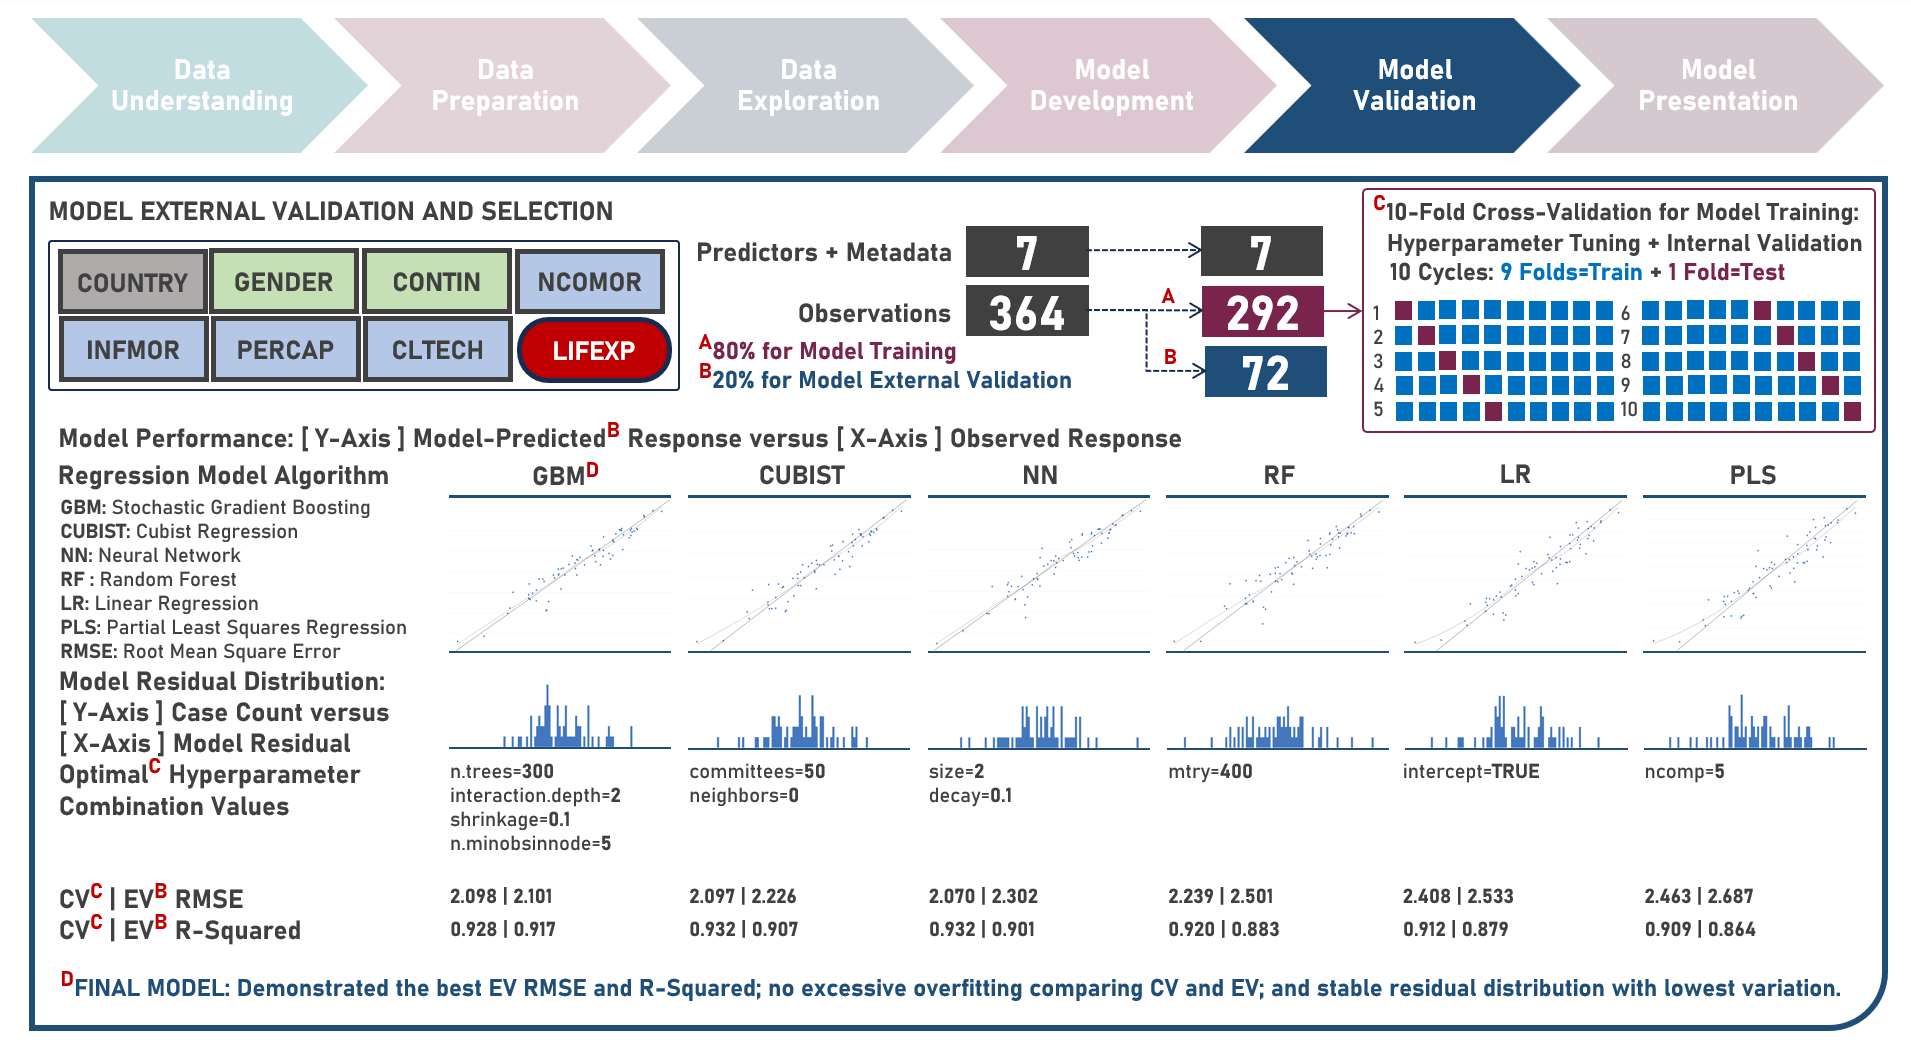
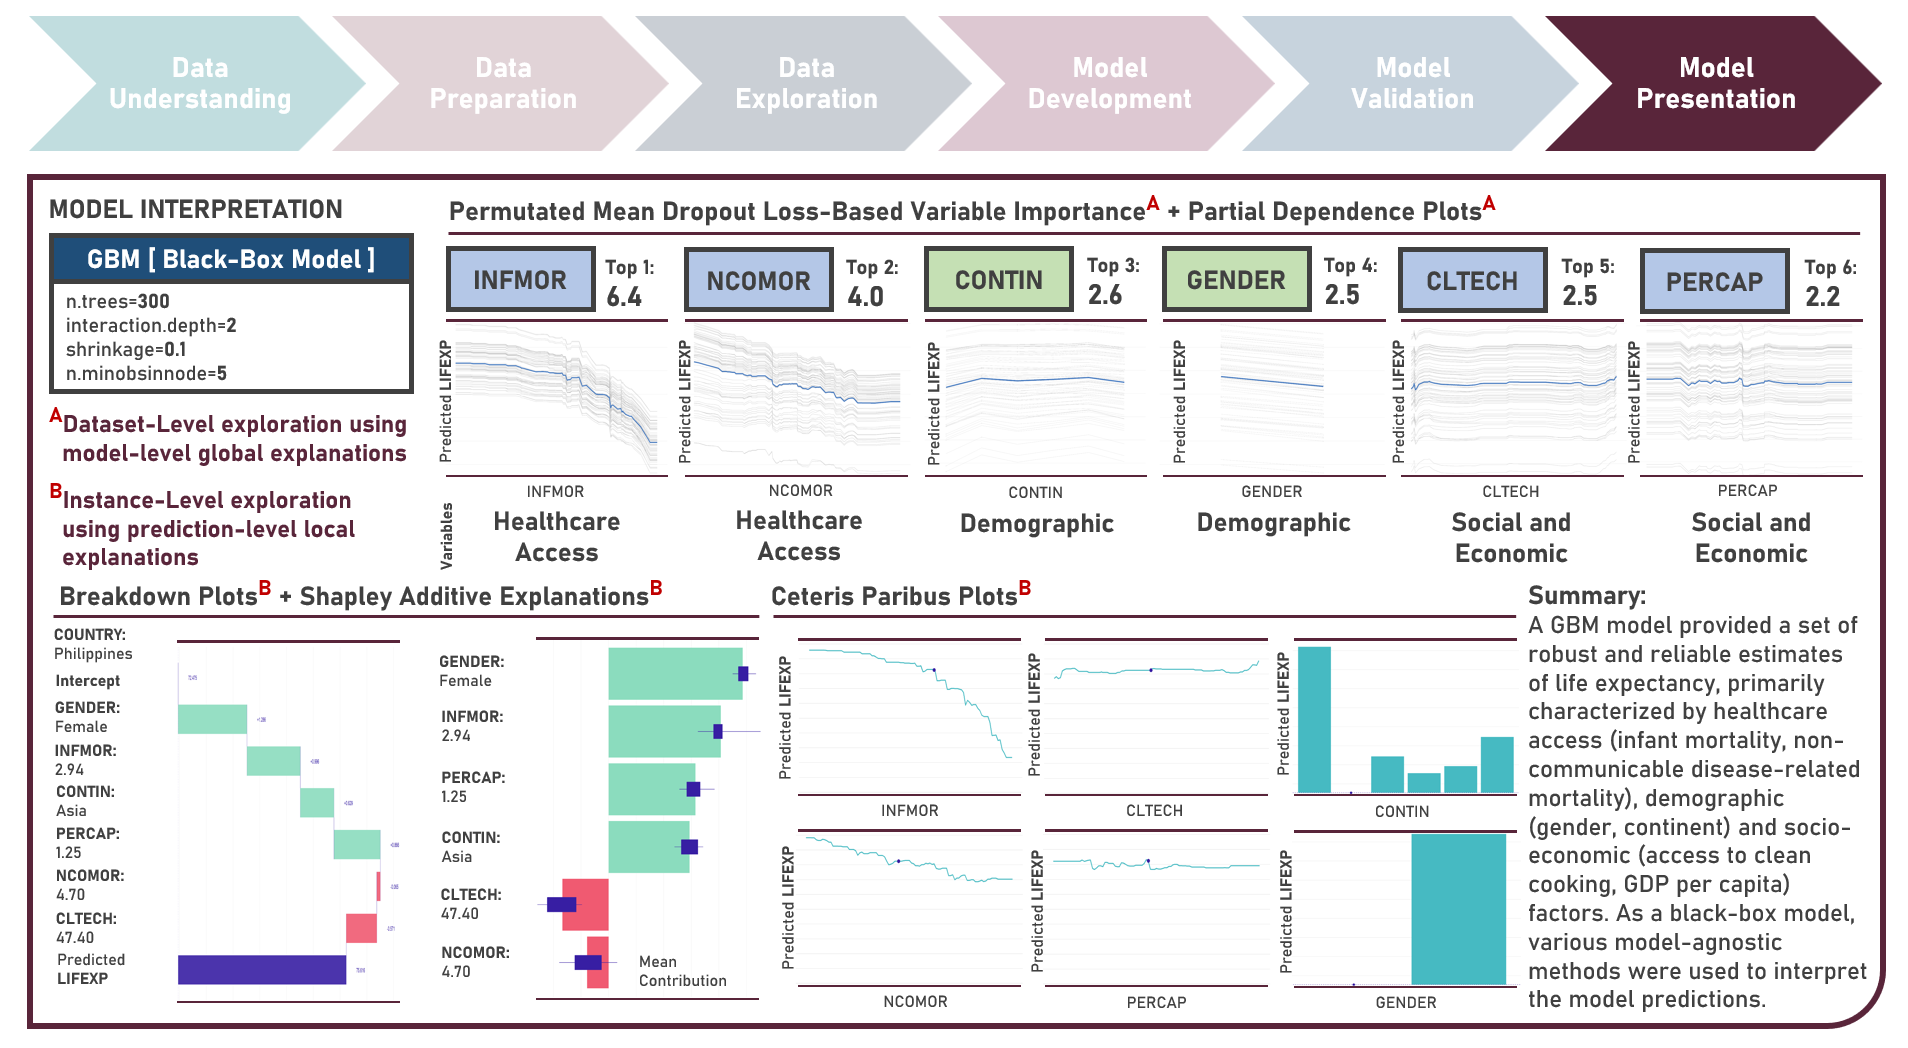
Life expectancy is a statistical measure that represents the average number of years a person is expected to live from birth, assuming current mortality rates remain constant along the entire life course. It provides an estimation of the overall health and well-being of a population and is often reflective of the local conditions encompassing numerous factors including demographic, socio-economic, healthcare access and healthcare quality. This case study aims to develop an interpretable regression model which could provide robust and reliable estimates of life expectancy from an optimal set of observations and predictors, while delivering accurate predictions when applied to new unseen data. Data quality assessment and model-independent feature selection were conducted on the initial dataset to identify and remove cases or variables noted with irregularities, in adddition to the subsequent preprocessing operations most suitable for the downstream analysis. Multiple regression models with optimized hyperparameters were formulated using Stochastic Gradient Boosting, Cubist Regression, Neural Network, Random Forest, Linear Regression and Partial Least Squares Regression. Model performance among candidate models was compared using the Root Mean Square Error (RMSE) and R-Squared metrics, evaluated internally (using K-Fold Cross Validation) and externally (using an Independent Test Set). Post-hoc exploration of the model results to provide insights on the importance, contribution and effect of the various predictors to model prediction involved model agnostic methods including Dataset-Level Exploration using model-level global explanations (Permutated Mean Dropout Loss-Based Variable Importance, Partial Dependence Plots) and Instance-Level Exploration using prediction-level local explanations (Breakdown Plots, Shapley Additive Explanations, Ceteris Paribus Plots, Local Fidelity Plots, Local Stability Plots).
Machine Learning Exploratory Projects
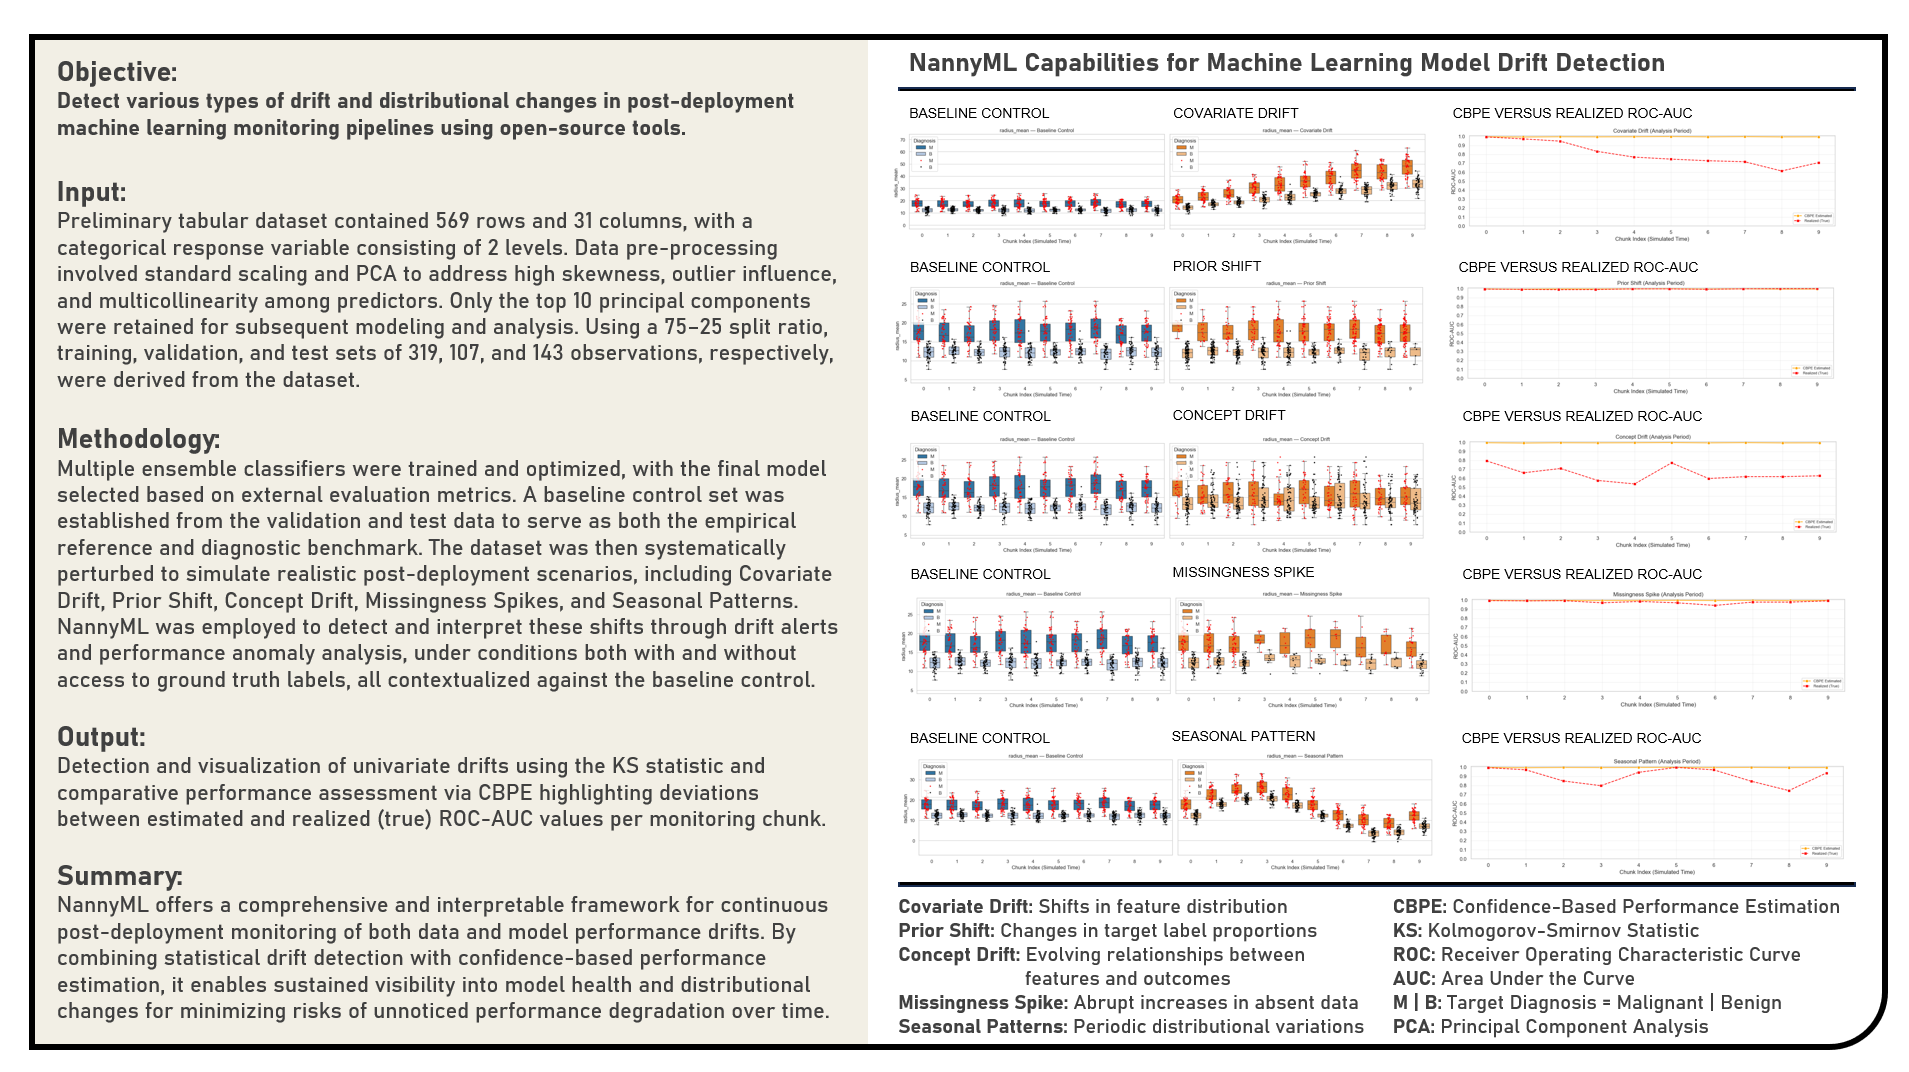
This project explores open-source approaches for monitoring machine learning models after deployment, with a focus on leveraging NannyML to detect, interpret, and quantify data and performance drifts in production pipelines. The primary objective was to assess how various types of drift including Covariate Drift, Prior Shift, Concept Drift, Missingness Spikes, and Seasonal Patterns manifest in post-deployment environments and to demonstrate how proactive monitoring can mitigate the risks of model degradation and bias. The workflow began with building and evaluating a baseline predictive model, which served as a stability reference for diagnostic comparisons. The dataset was systematically perturbed to emulate realistic operational conditions, enabling the controlled study of different drift scenarios. NannyML’s Kolmogorov–Smirnov (KS) Statistic and Confidence-Based Performance Estimation (CBPE) methods were applied to measure distributional changes and estimate model performance both with and without access to ground truth labels. Through comparative analysis between baseline and perturbed conditions, the project illustrated how continuous monitoring provides early warning signals of model instability—enhancing reliability and accountability beyond traditional offline evaluations. Overall, the study highlighted the importance of incorporating tools like NannyML into modern MLOps frameworks to enable sustainable model governance, interpretability, and long-term performance assurance.
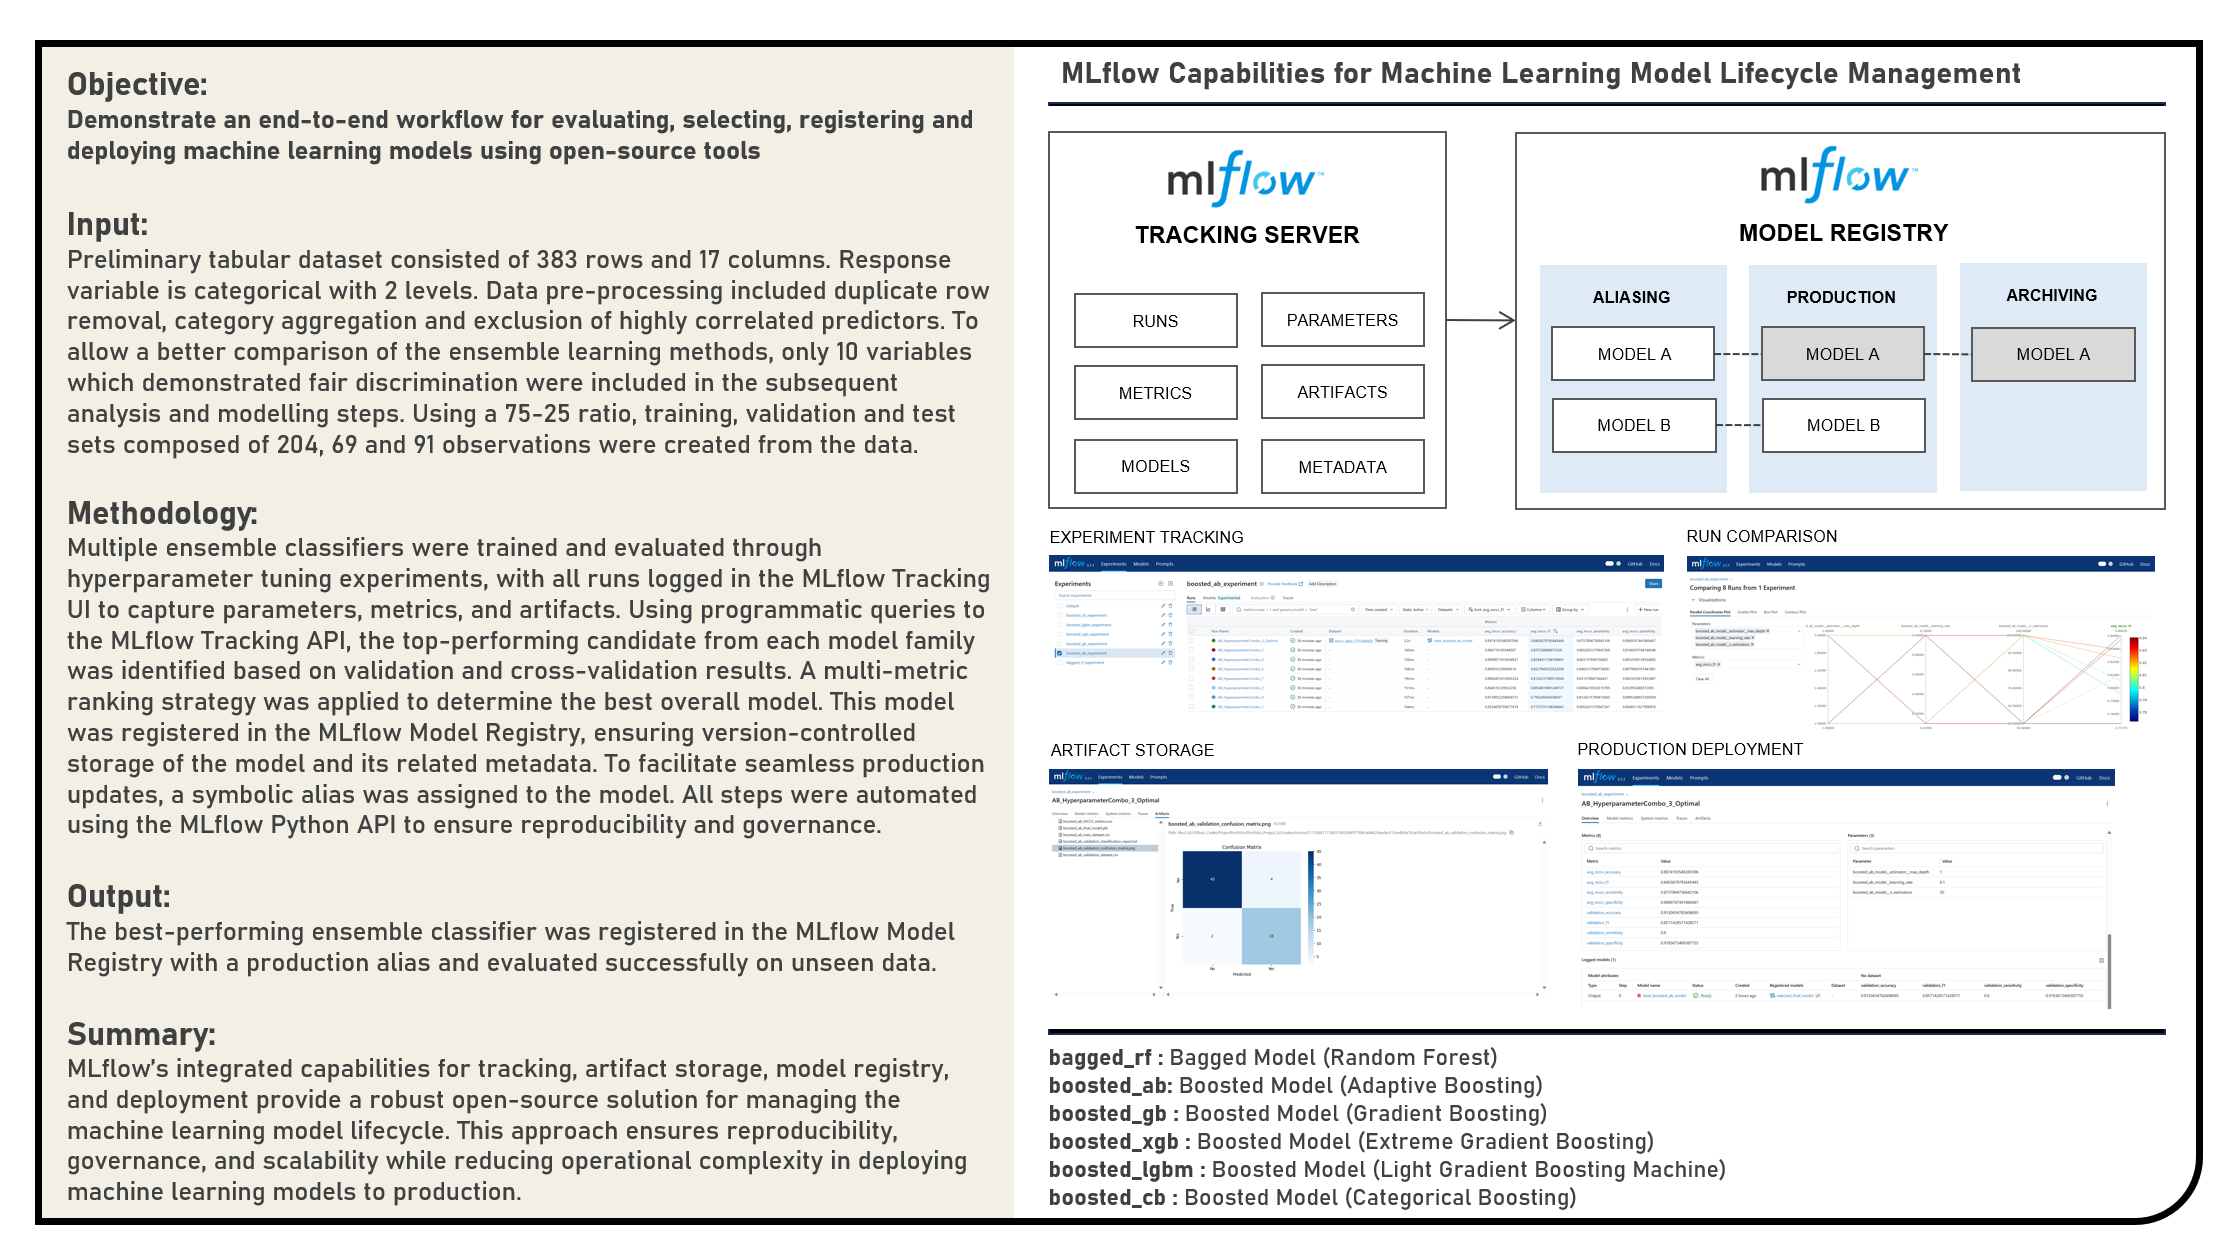
This project explores open-source solutions for managing the complete lifecycle of machine learning models, with a focus on leveraging MLflow for experiment tracking, model selection, and production deployment. The objective was to design a reproducible and automated workflow for evaluating multiple ensemble classifiers, selecting the top-performing model through systematic comparison, and operationalizing it for production use. The workflow began with multiple ensemble learning methods - Random Forest, Adaptive Boosting, Gradient Boosting, Extreme Gradient Boosting, Light Gradient Boosting Machines and Categorical Boosting algorithms - undergoing hyperparameter tuning, with all experiments logged in the MLflow Tracking UI for organized performance monitoring. The highest-performing model was identified using a multi-metric ranking approach involving the F1 Score, Sensitivity, Specificity and Accuracy metrics, and then registered in the MLflow Model Registry to ensure version-controlled storage alongside its metadata and artifacts. A symbolic alias was assigned to streamline future updates and eliminate the need for hardcoded version references in production. The resulting production-ready model was validated on unseen data, confirming its generalization capability. By integrating tracking, artifact management, registry operations, and deployment through MLflow’s open-source capabilities, this project demonstrated a robust and scalable MLOps workflow that enhances reproducibility, governance, and operational efficiency in deploying machine learning models to production environments.
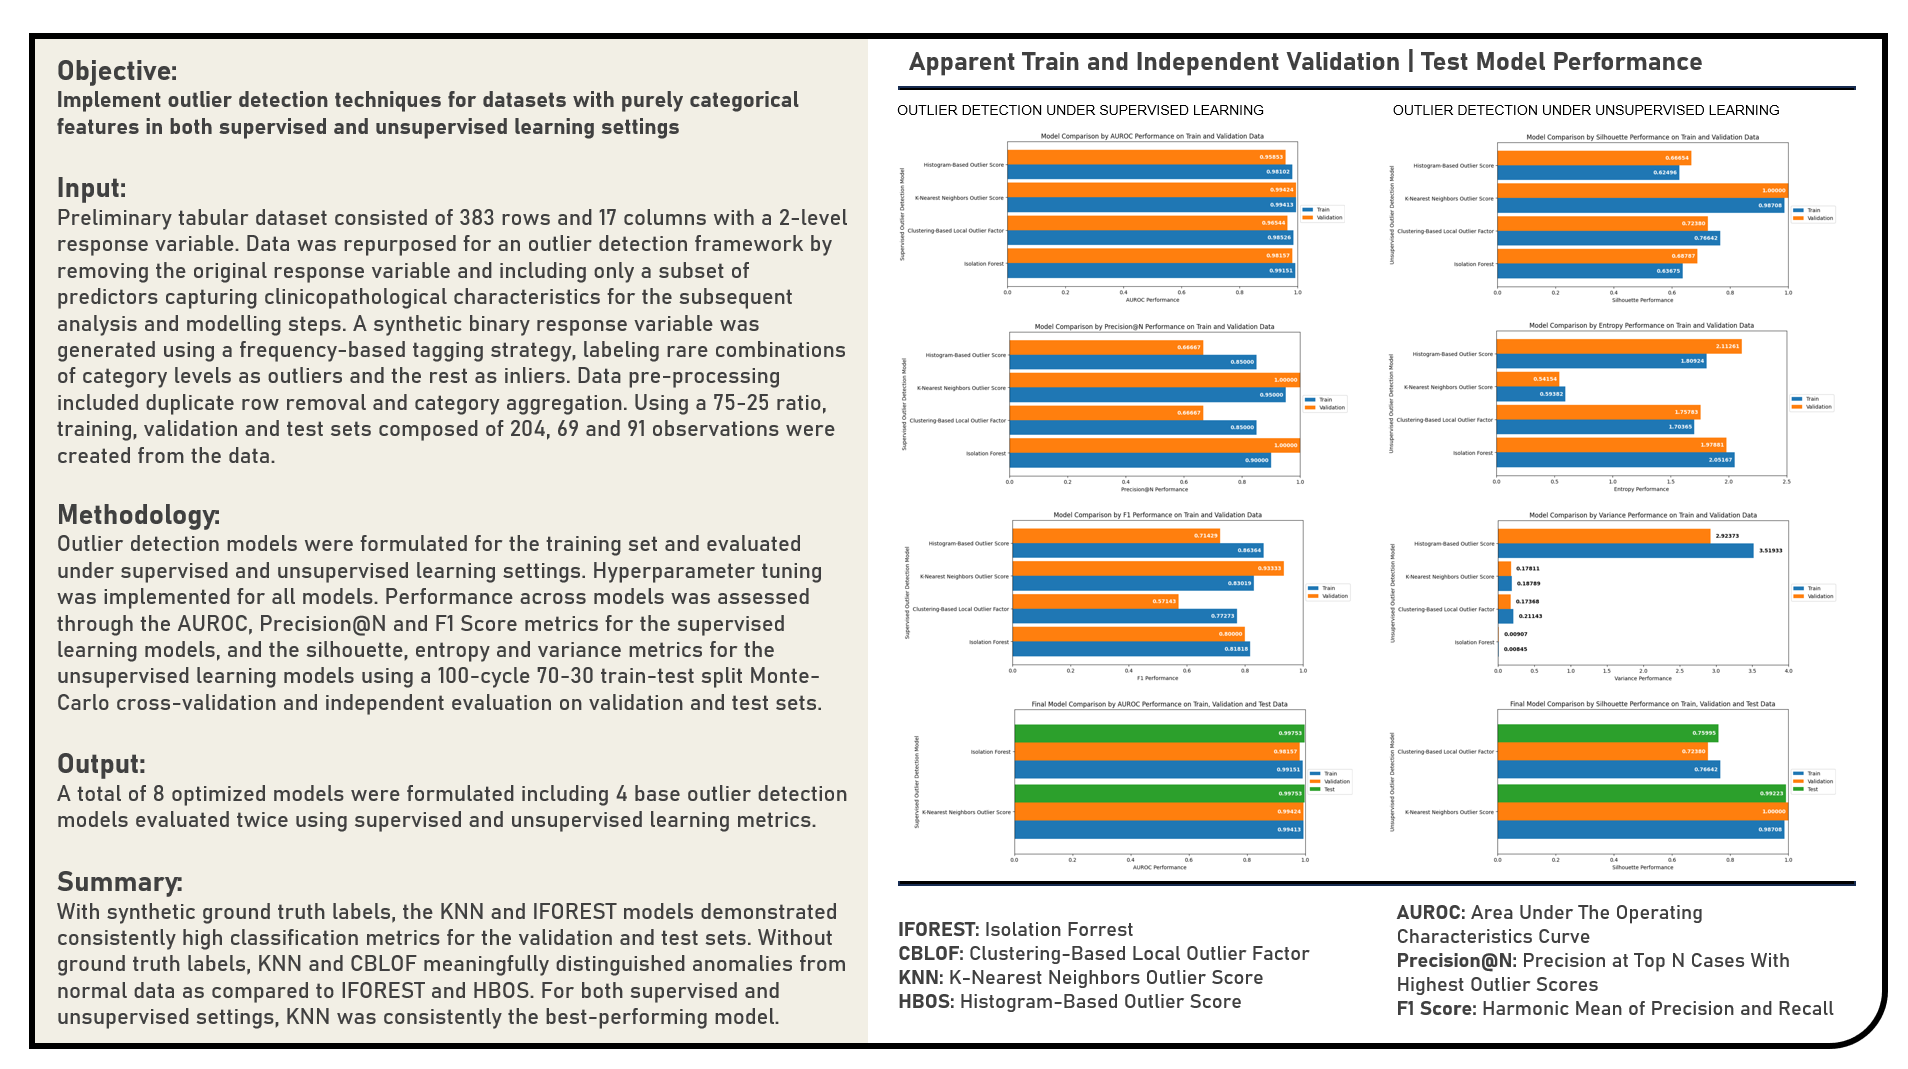
This project investigates the performance of outlier detection models specifically applied to datasets composed exclusively of categorical features, adopting an evaluation framework under both supervised and unsupervised learning settings. In the supervised framework, synthetic ground truth labels were utilized to evaluate model performance using classification-based metrics, while the unsupervised framework operated without any label assumptions, relying instead on score-distribution properties and internal structural metrics. A variety of non-deep learning models were explored, including Isolation Forest, Clustering-Based Local Outlier Factor (CBLOF), K-Nearest Neighbors (KNN), and Histogram-Based Outlier Score (HBOS), all chosen for their compatibility with categorical or preprocessed categorical data. Model performance in the supervised setting was assessed using AUROC, Precision@N, and F1-score, capturing different aspects of classification quality and ranking accuracy. In the unsupervised setting, model outputs were evaluated using the Silhouette Score on Outlier Scores, Outlier Score Entropy, and Score Variance—each offering complementary insight into the separability, uncertainty, and spread of anomaly scores. These quantitative evaluations were supplemented by Principal Component Analysis (PCA) and Uniform Manifold Approximation and Projection (UMAP) visualizations to assess the spatial distribution and structural clustering of the outlier scores in low-dimensional embeddings. A Monte Carlo cross-validation strategy was implemented in both settings to support robust hyperparameter tuning and generalization assessment across 100 iterations.
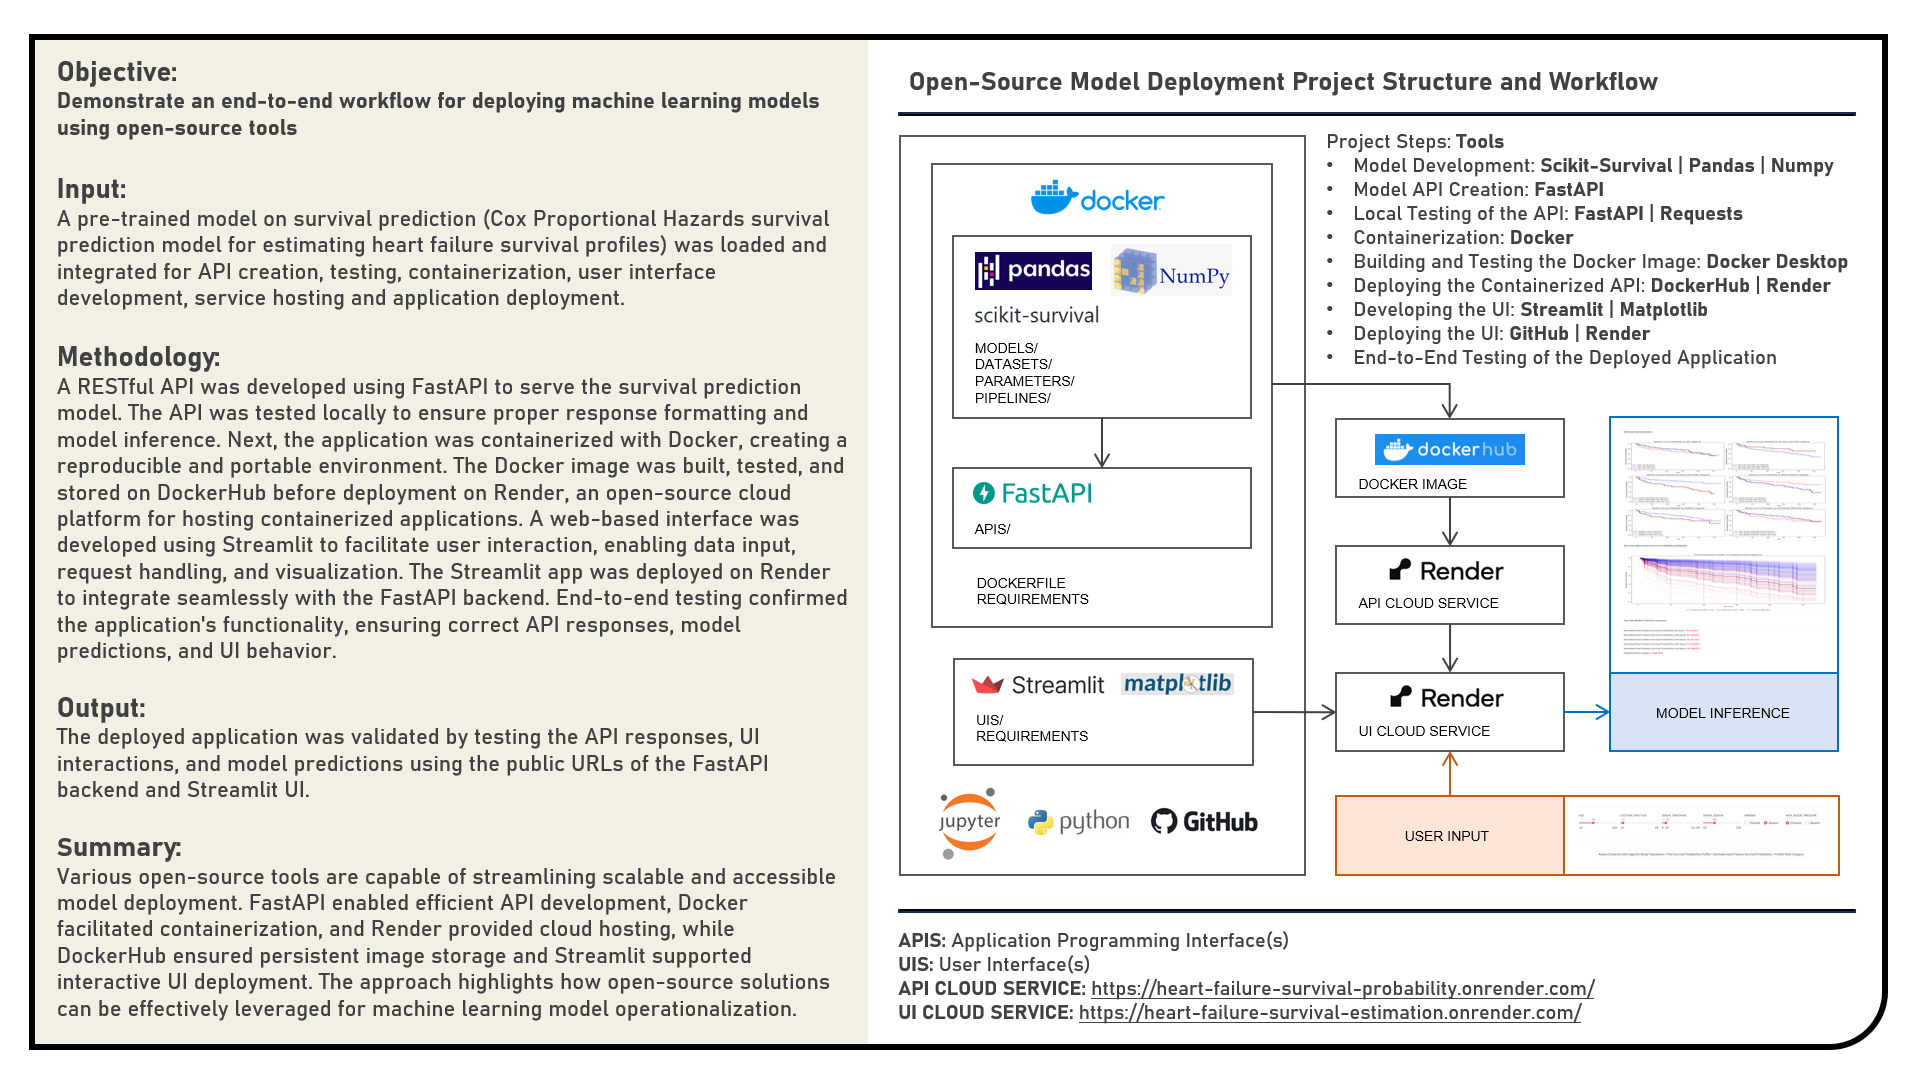
This project explores open-source solutions for containerizing and deploying machine learning API endpoints, focusing on the implementation of a heart failure survival prediction model as a web application. The objective was to operationalize a Cox Proportional Hazards Regression survival model by deploying an interactive UI that enables users to input cardiovascular, hematologic, and metabolic markers and receive survival probability estimates at different time points. The project workflow involved multiple stages: first, a RESTful API was developed using the FastAPI framework to serve the survival prediction model. The API was tested locally to ensure correct response formatting and model inference behavior. Next, the application was containerized using Docker, enabling a reproducible and portable environment. The Docker image was built, tested, and pushed to DockerHub for persistent storage before being deployed on Render, an open-source cloud platform for hosting containerized applications. To enable user interaction, a web-based interface was developed using Streamlit. The UI facilitated data input via range sliders and radio buttons, processed user entries, and sent requests to the FastAPI backend for prediction and visualization. The Streamlit app was then deployed on Render to ensure full integration with the containerized API. End-to-end testing verified the functionality of the deployed application, confirming that API endpoints, model predictions, and UI elements worked seamlessly together.
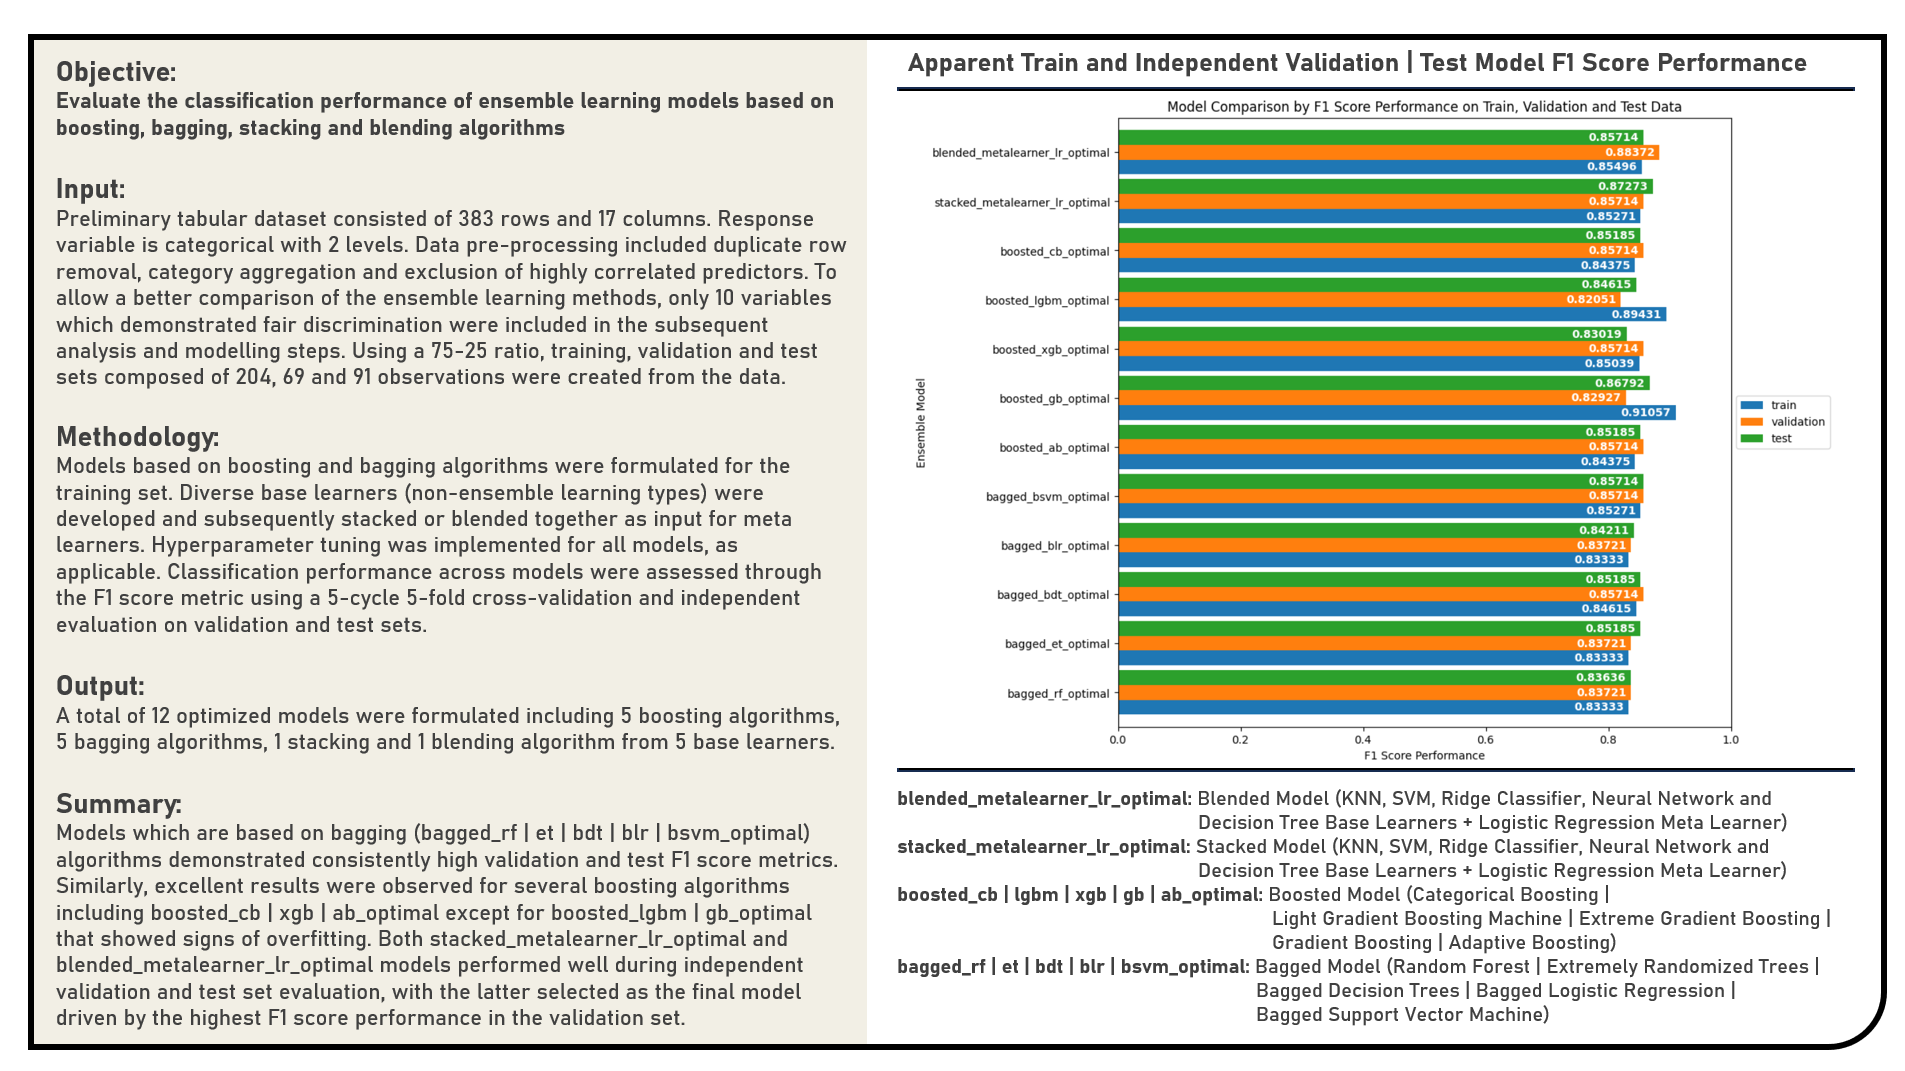
This project explores different ensemble learning approaches which combine the predictions from multiple models in an effort to achieve better predictive performance. The ensemble frameworks applied in the analysis were grouped into three classes including boosting models which add ensemble members sequentially that correct the predictions made by prior models and outputs a weighted average of the predictions; bagging models which fit many individual learners on different samples of the same dataset and averaging the predictions; and stacking or blending models which consolidate many different model types on the same data using base learners and applying a separate meta learner to learn how to best combine the predictions. Boosting models included the Adaptive Boosting, Gradient Boosting, Extreme Gradient Boosting, Light Gradient Boosting Machines and Categorical Boosting algorithms. Bagging models applied were the Random Forest, Extremely Randomized Trees, Bagged Decision Trees, Bagged Logistic Regression and Bagged Support Vector Machine algorithms. Individual base learners including the K-Nearest Neighbors, Support Vector Machine, Ridge Classifier, Neural Network and Decision Tree algorithms were formulated with predictions stacked or blended together as contributors to the Logistic Regression meta learner. The resulting predictions derived from all ensemble learning models were evaluated based on their classification performance using the F1 Score metric.
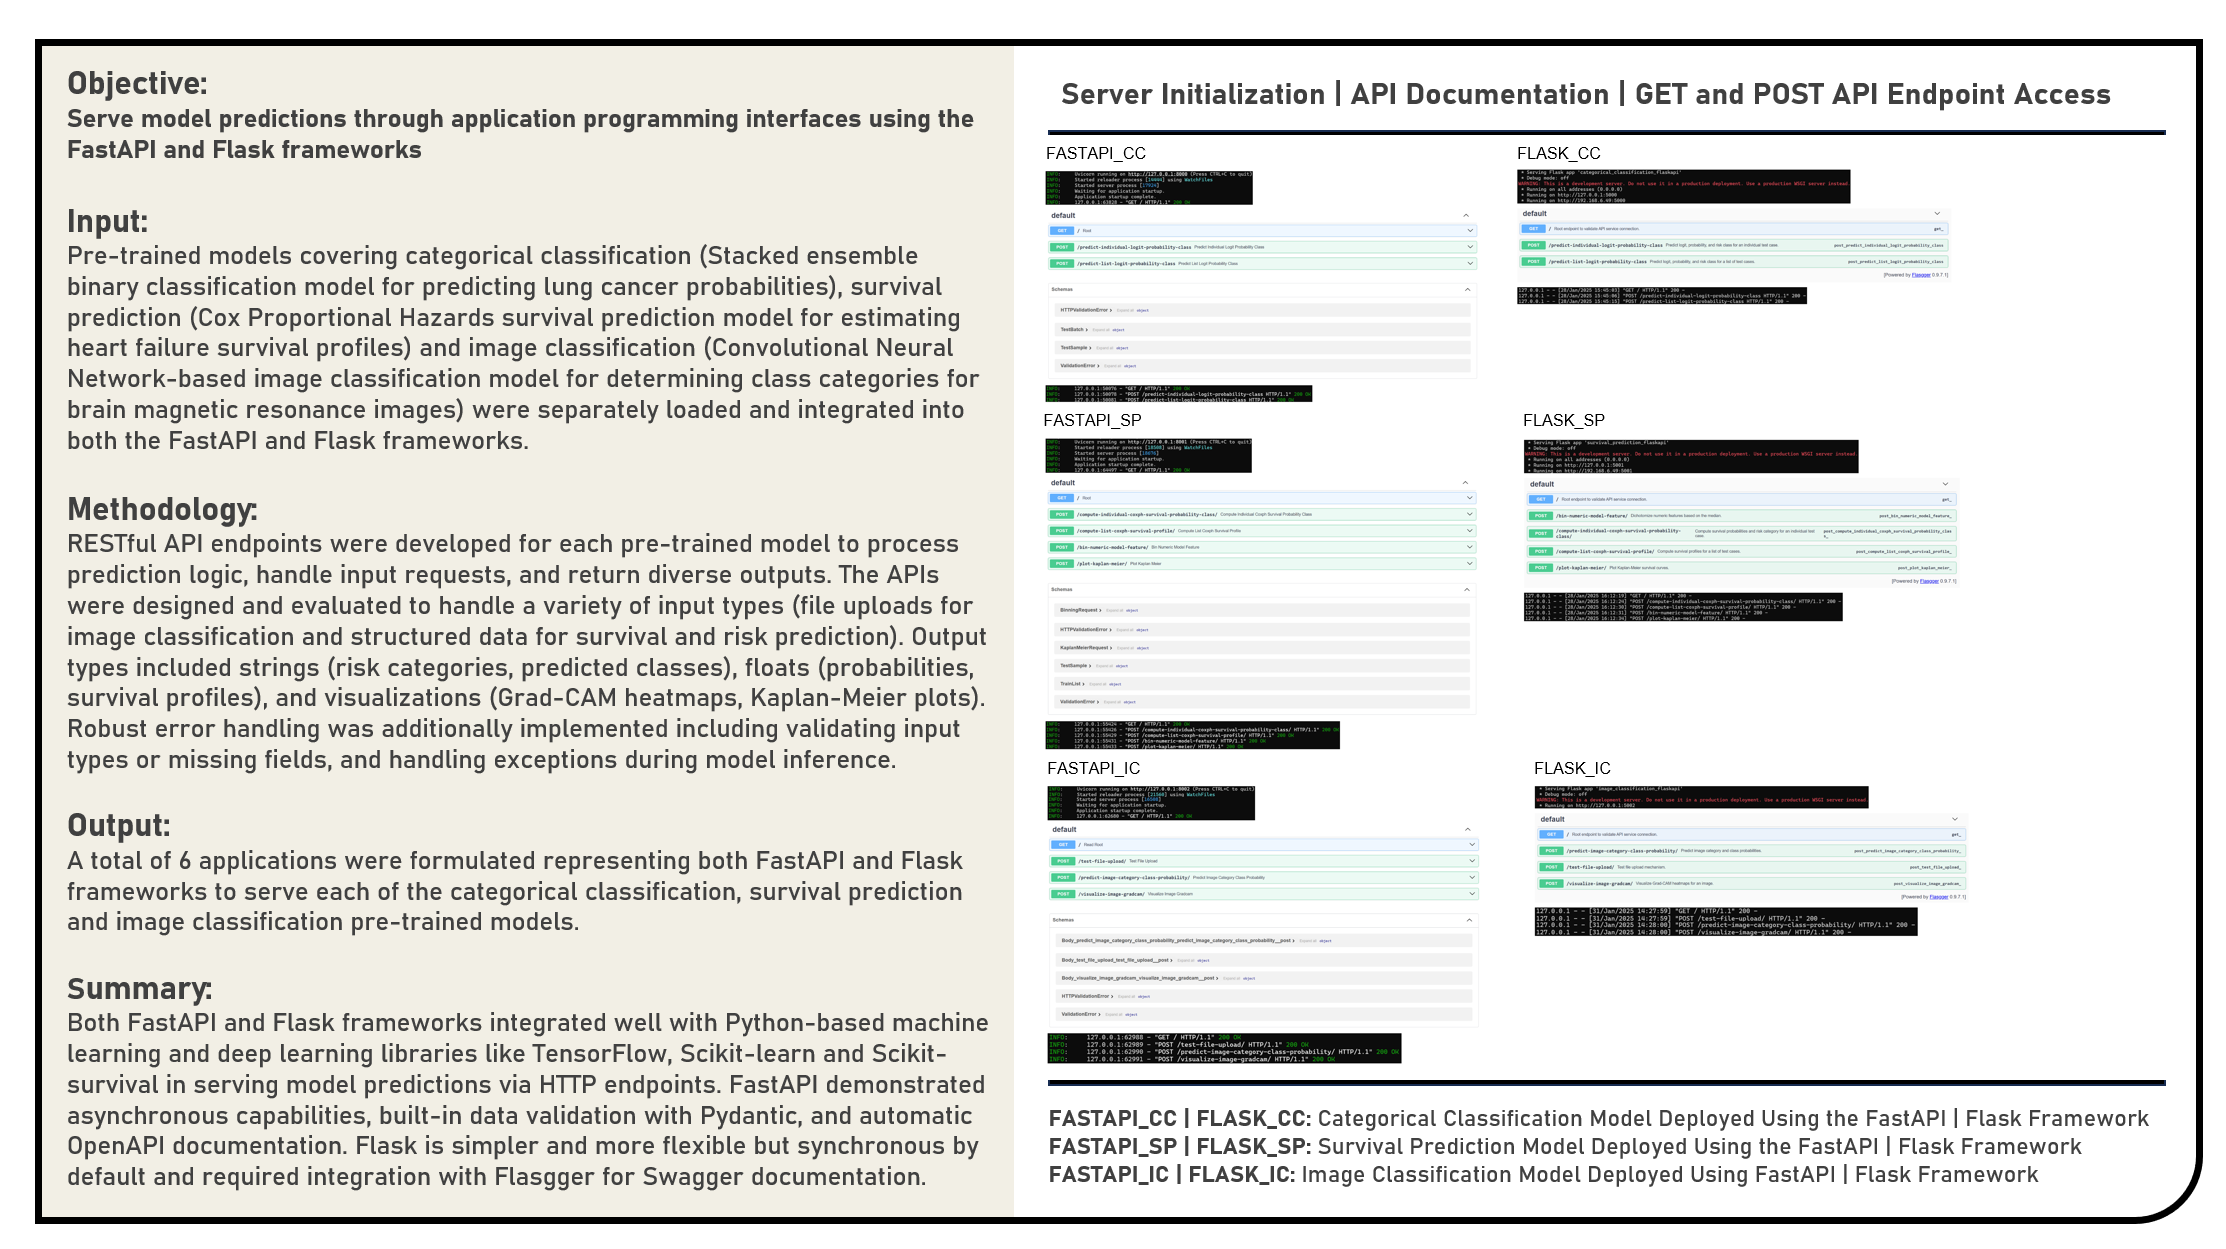
This project examines the modular deployment of machine and deep learning models through Representational State Transfer (RESTful) Application Programming Interfaces (APIs), focusing on a comparative analysis of FastAPI and Flask, two Python-based frameworks. Various pre-trained models were integrated into these APIs, including a Stacked ensemble binary classifier for lung cancer risk assessment, a Cox Proportional Hazards model for predicting heart failure survival, and a Convolutional Neural Network for brain MRI image classification. The developed FastAPI and Flask applications were evaluated in terms of implementing and documenting RESTful endpoints, managing data preprocessing and inference logic, handling diverse input formats (structured data for classification and survival predictions, as well as file uploads for image analysis), supporting multiple output types (such as strings, floats, lists, and base64-encoded visualizations), and ensuring robust error handling and validation mechanisms.
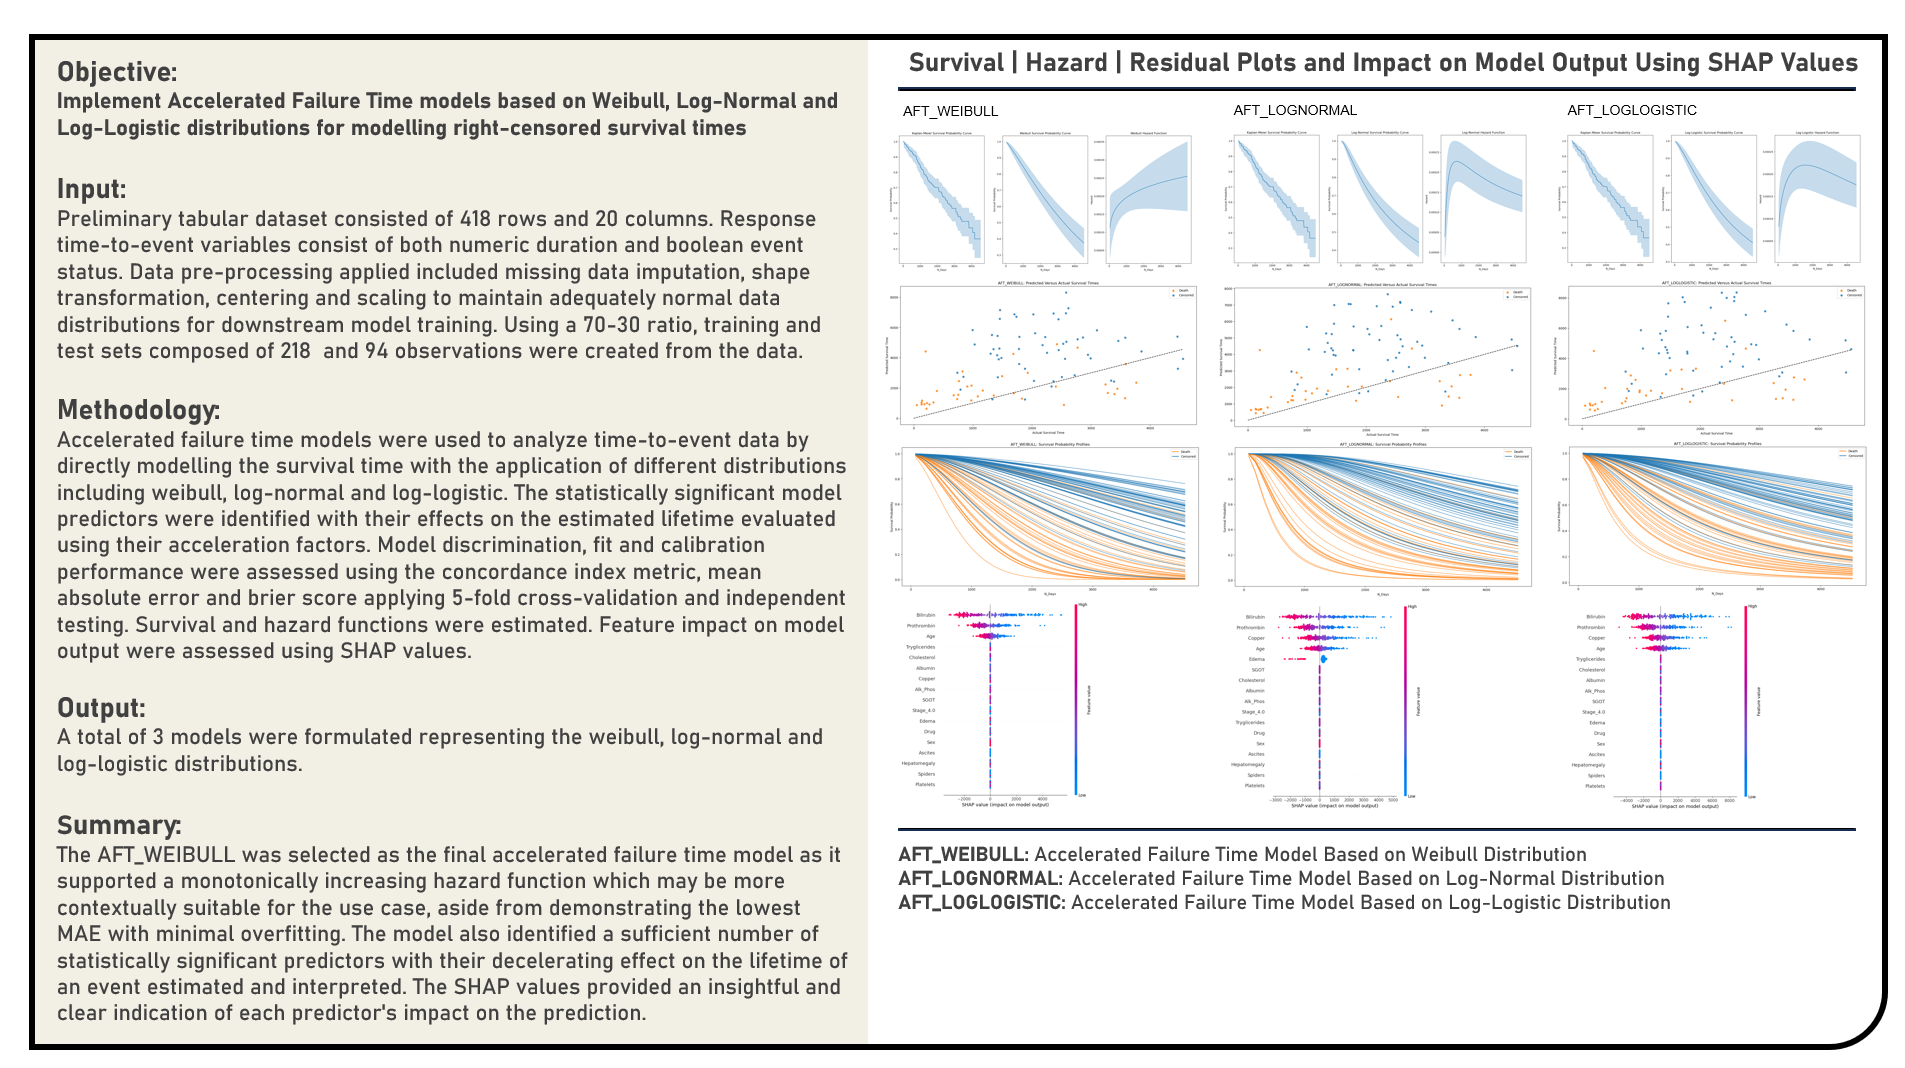
This project implements Accelerated Failure Time Models based on the Weibull, Log-Normal and Log-Logistic distributions to analyze time-to-event data by directly modelling the survival time. The statistically significant model predictors were identified with their effects on the estimated lifetime evaluated using their acceleration factors. The resulting predictions derived from the candidate models were evaluated in terms of their discrimination power, fit and calibration performance using the concordance index metric, mean absolute error and brier score. Feature impact on model output were assessed using Shapley Additive Explanations. Survival and hazard functions were estimated.
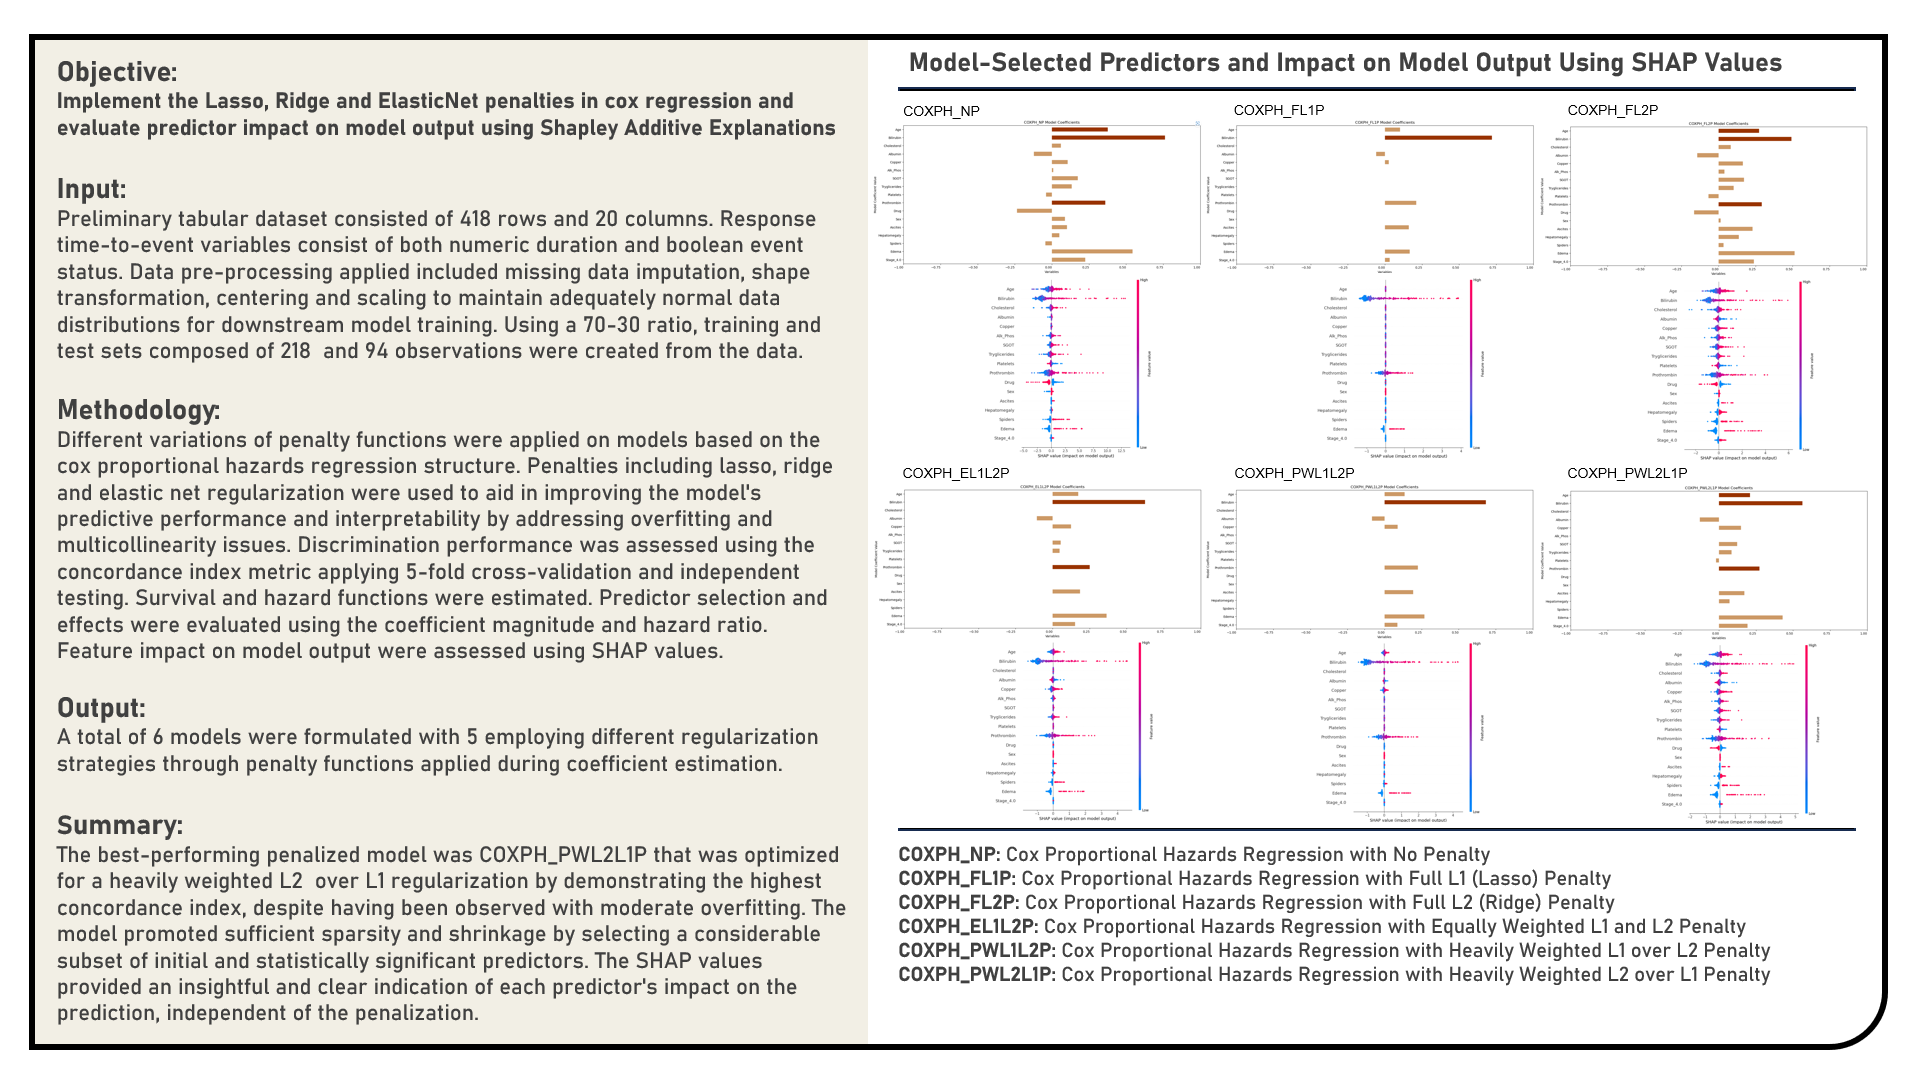
This project explores different variations of penalty functions as applied on models for right-censored time-to-event responses. Using the standard Cox Proportional Hazards Regression structure as reference, regularization methods including Least Absolute Shrinkage and Selection Operator, Ridge and Elastic Net were used to aid in improving the model’s predictive performance and interpretability by addressing overfitting and multicollinearity issues. The resulting predictions derived from the candidate models were evaluated in terms of their discrimination power using the concordance index metric. Predictor selection and effects were determined using the coefficient magnitude and hazard ratio. Feature impact on model output were assessed using Shapley Additive Explanations. The differences in survival probabilities for different risk groups were additionally examined using the Kaplan-Meier survival curves. The survival probability and hazard profiles for sampled individual cases were estimated.
Supervised Learning : Modelling Right-Censored Survival Time and Status Responses for Prediction
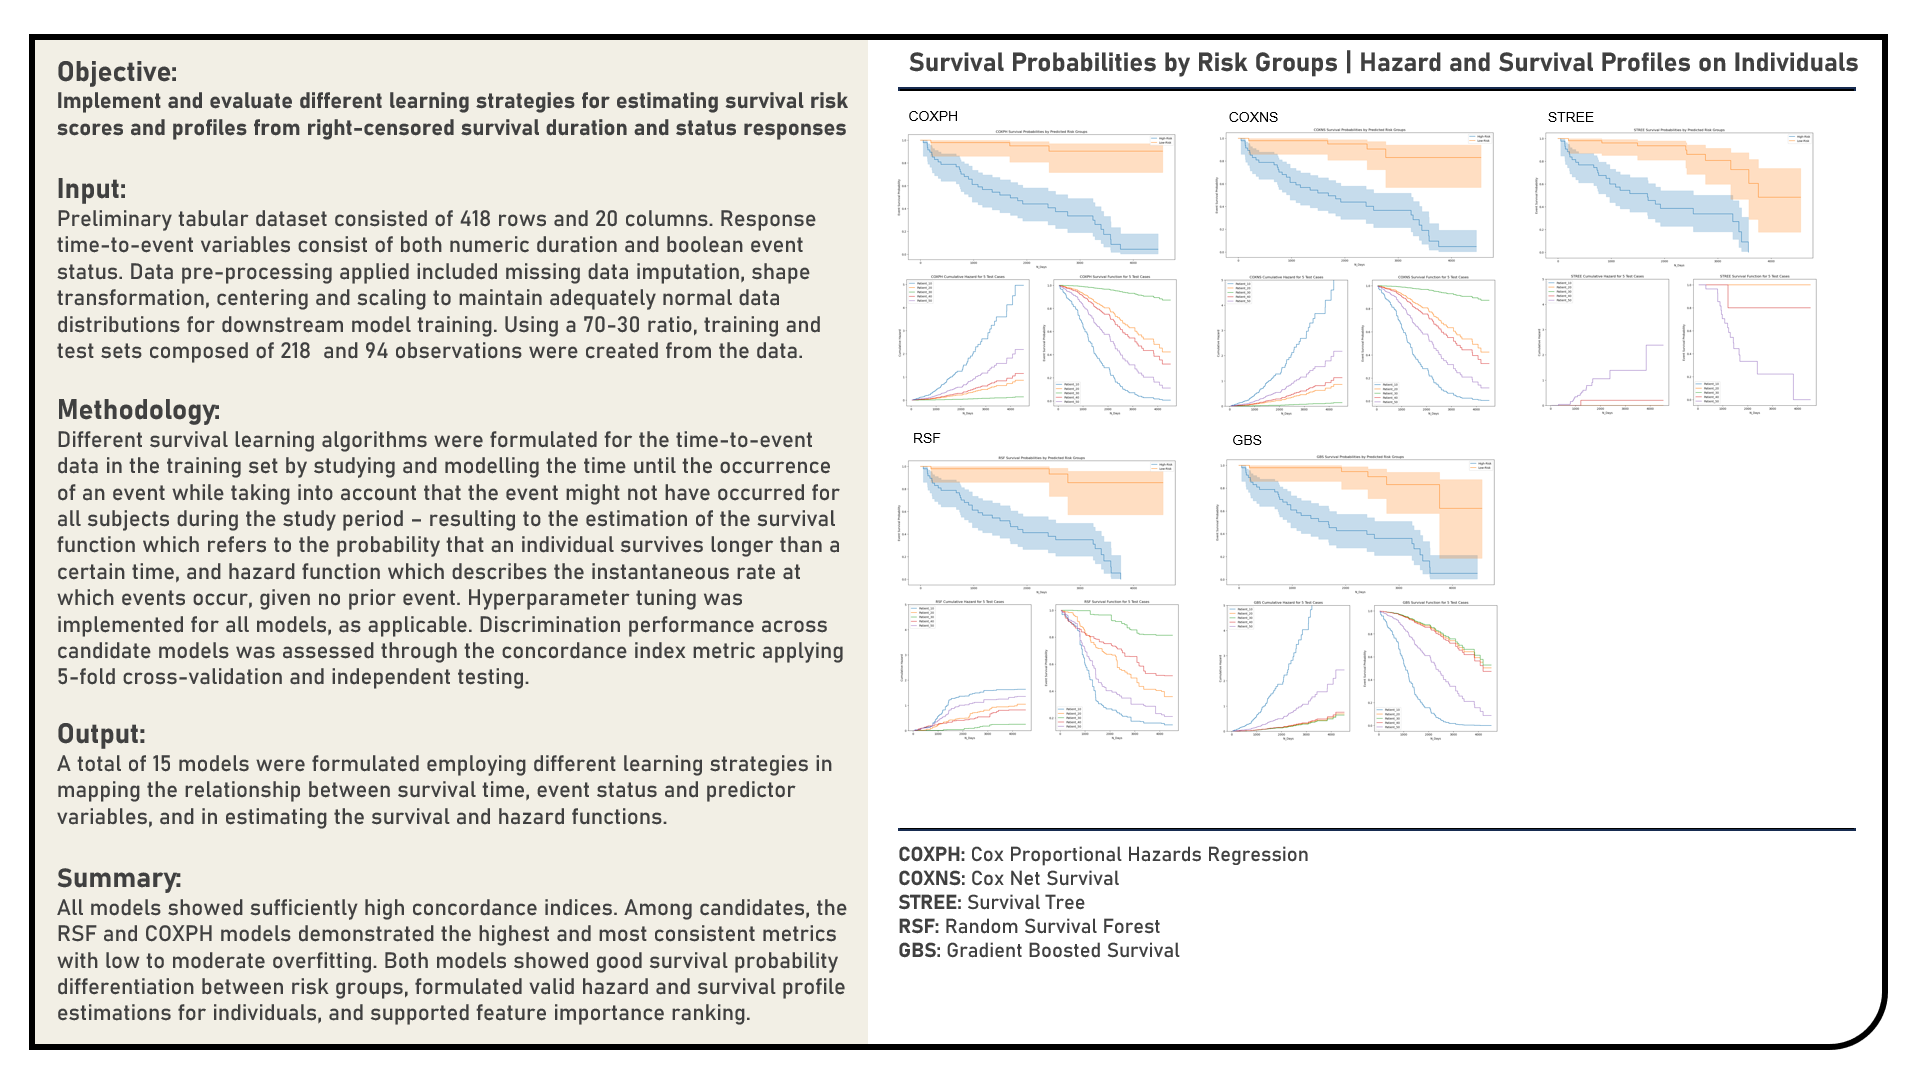
This project implements various predictive modelling procedures for right-censored time-to-event responses. Models applied in the analysis to estimate survival risk scores included the Cox Proportional Hazards Regression, Cox Net Survival, Survival Trees, Random Survival Forest and Gradient Boosted Survival algorithms. The resulting predictions derived from the candidate models were evaluated in terms of their discrimination power using the concordance index metric. The differences in survival probabilities for different risk groups were additionally examined using the Kaplan-Meier survival curves. The survival probability and hazard profiles for sampled individual cases were assessed. Permutation-based and absolute coefficient-based feature importance rankings were determined, as applicable, for model interpretation.
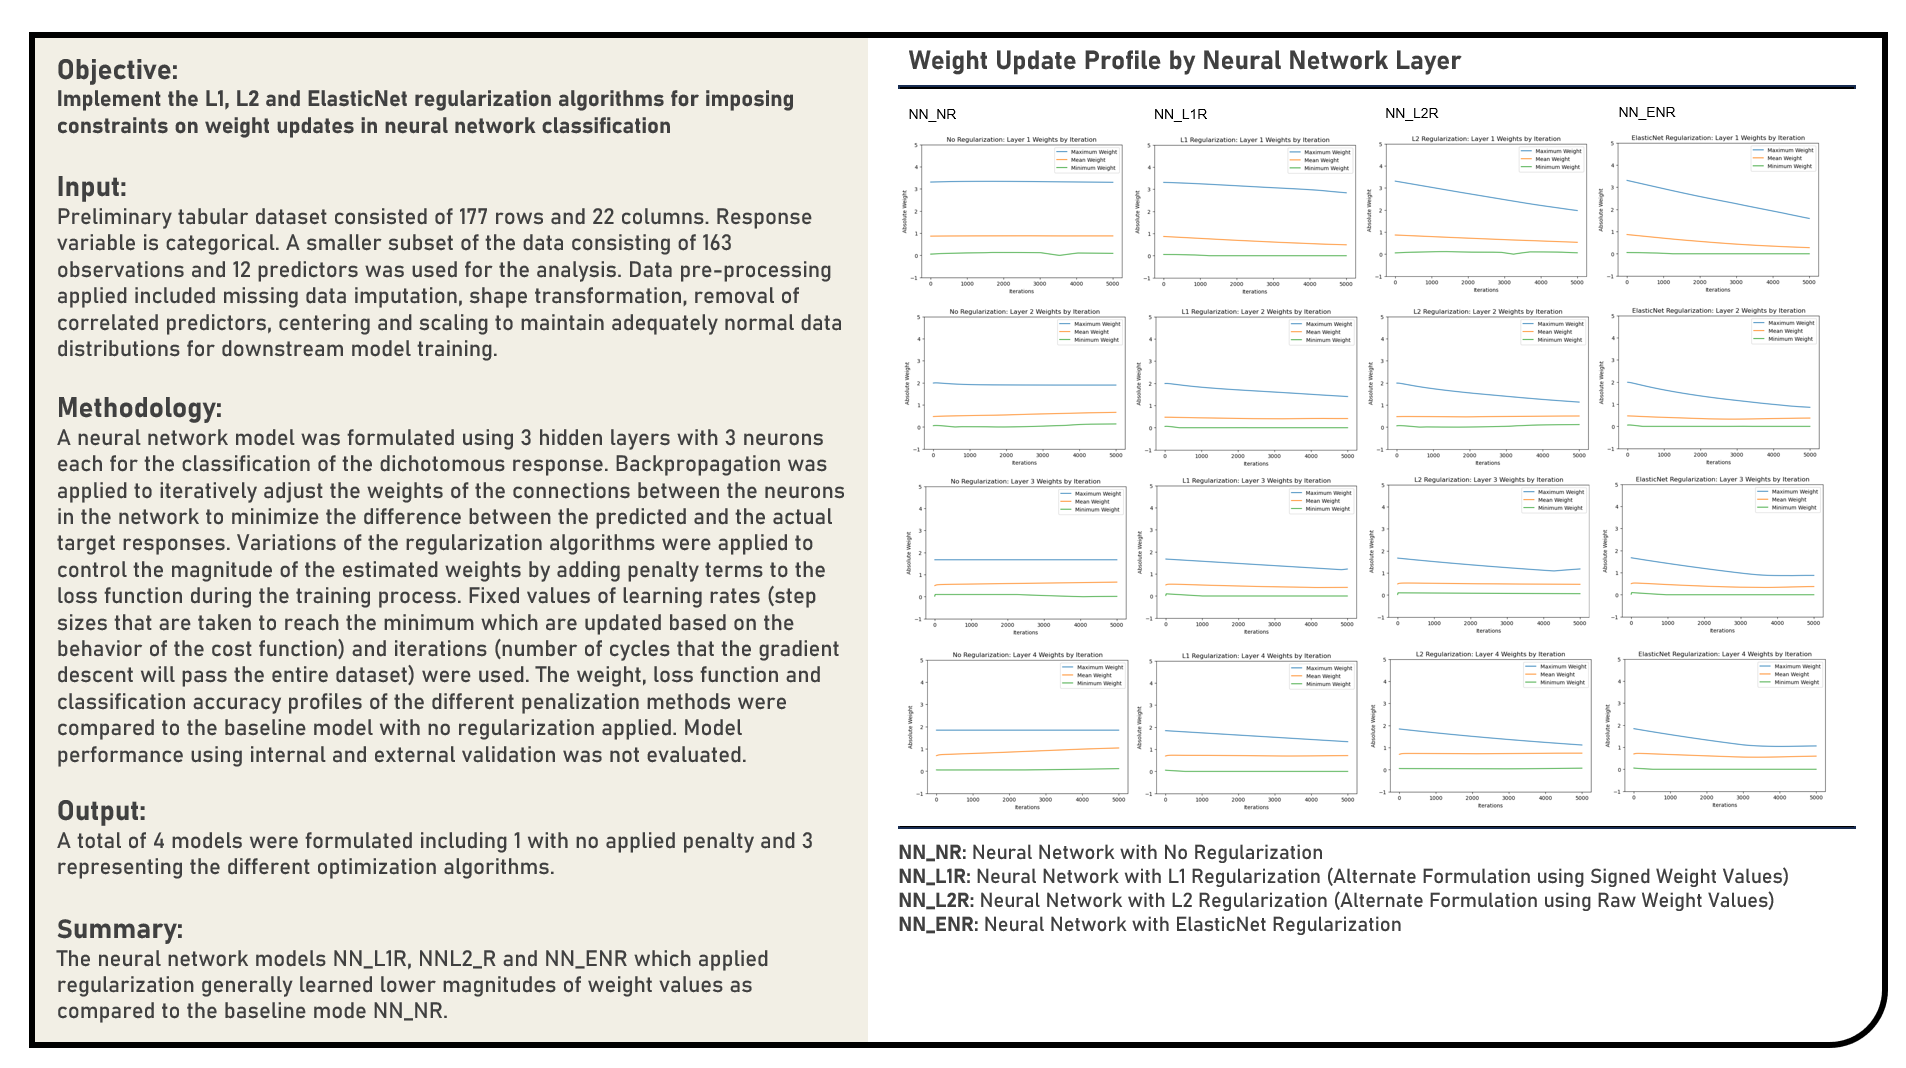
This project manually implements the Least Absolute Shrinkage and Selection Operator, Ridge and Elastic Net Regularization algorithms with fixed values applied for the learning rate and iteration count parameters to impose constraints on the weight updates of an artificial neural network classification model. The weight, cost function and classification accuracy optimization profiles of the different activation settings were evaluated and compared.
This project manually implements the Stochastic Gradient Descent Optimization, Adaptive Moment Estimation Optimization, Adaptive Gradient Optimization, AdaDelta Optimization, Layer-wise Optimized Non-convex Optimization and Root Mean Square Propagation Optimization algorithms with fixed values applied for the learning rate and iteration count parameters to optimally update the gradients and weights of an artificial neural network classification model. The cost function and classification accuracy optimization profiles of the different algorithms were evaluated and compared.
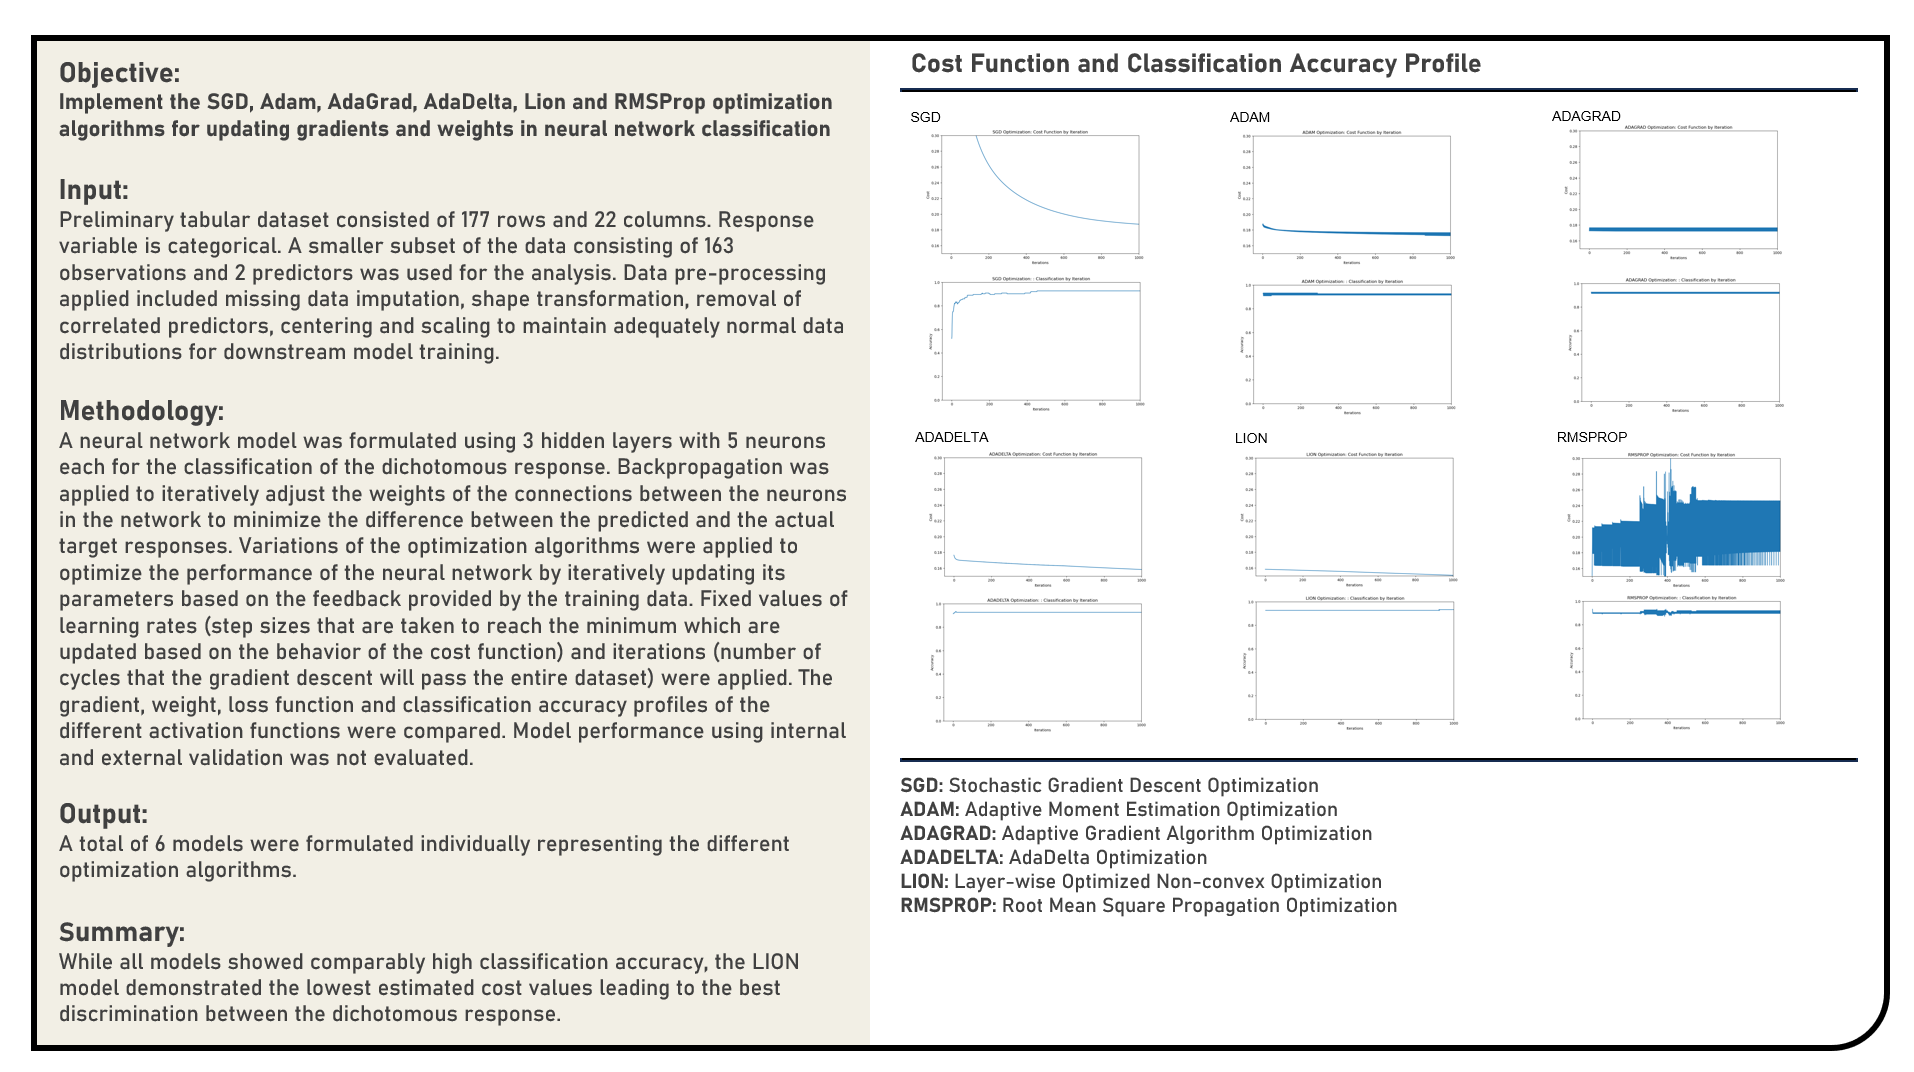
This project manually implements the Sigmoid, Rectified Linear Unit, Leaky Rectified Linear Unit, Exponential Linear Unit, Scaled Exponential Linear Unit and Randomized Leaky Rectified Linear Unit activation functions with fixed values applied for the learning rate and iteration count parameters to optimally update the gradients and weights of an artificial neural network classification model. The gradient, weight, cost function and classification accuracy optimization profiles of the different activation settings were evaluated and compared.
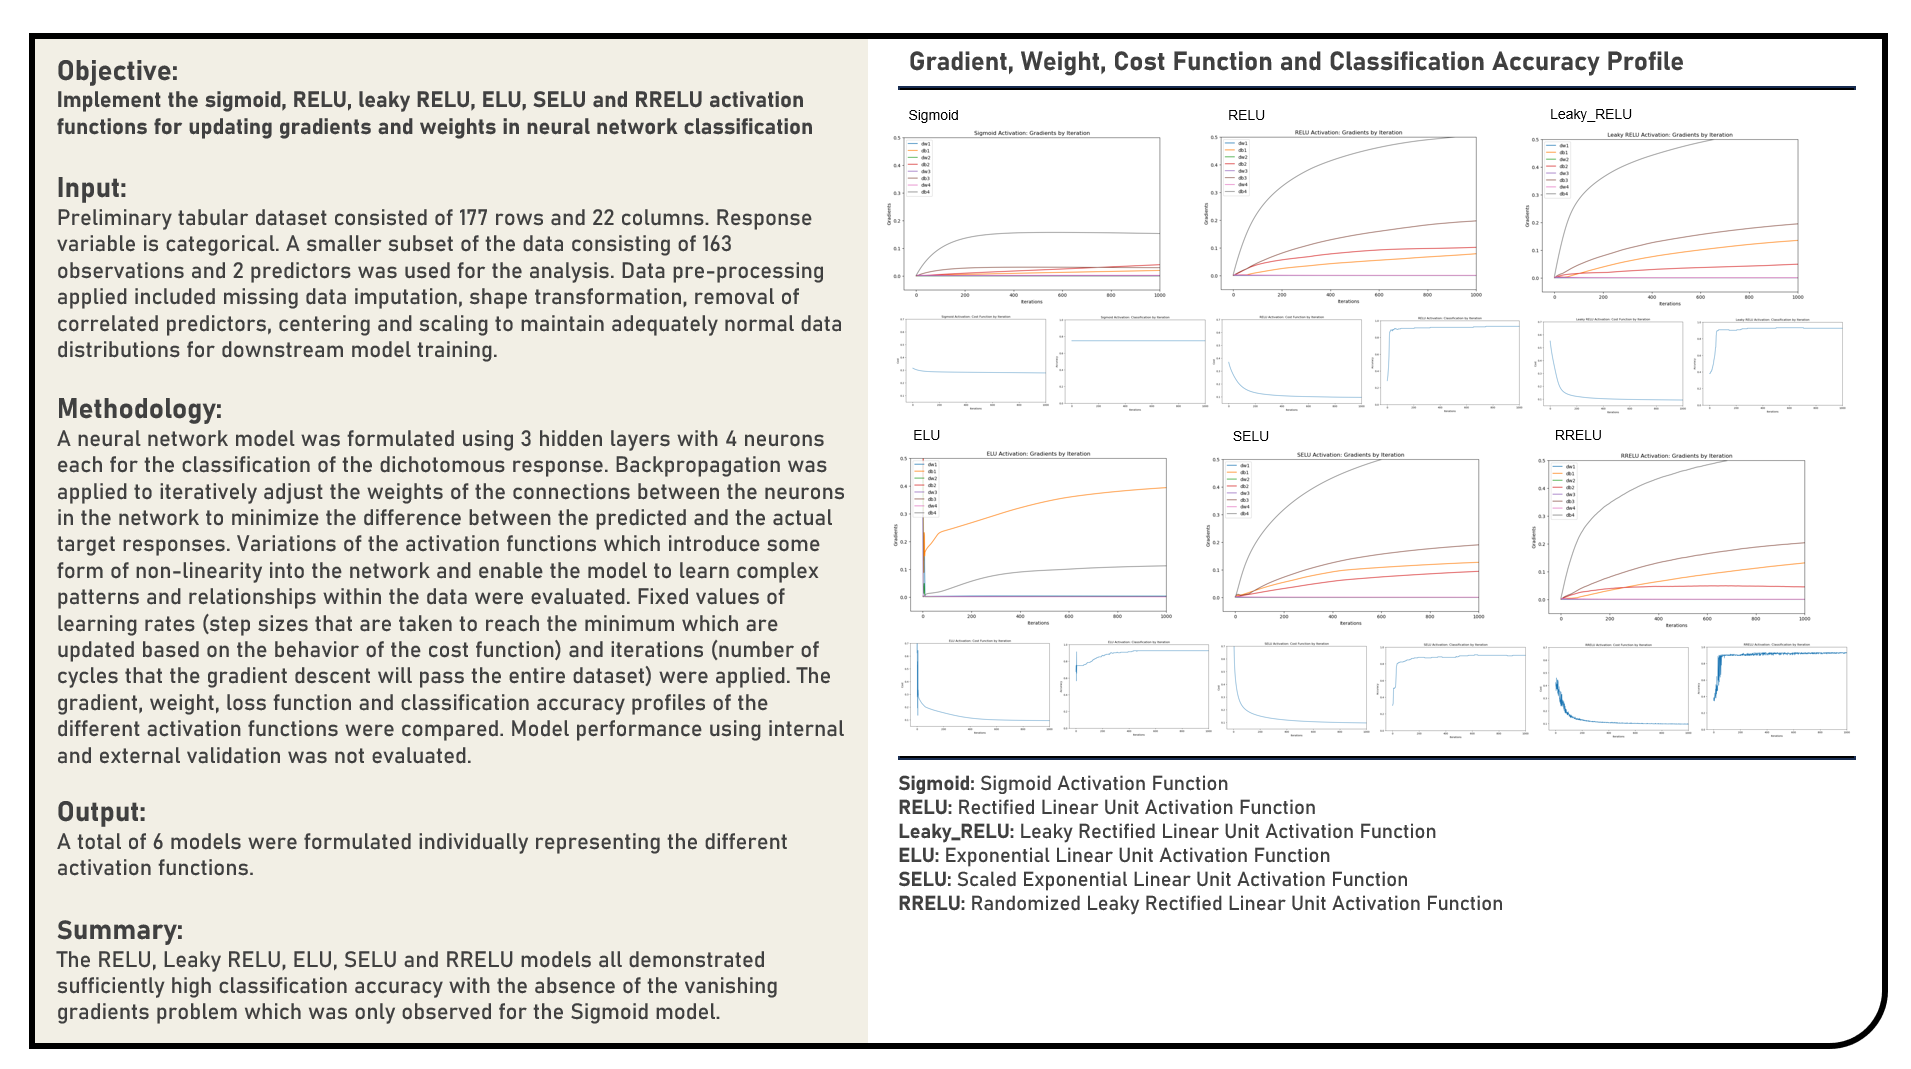
This project manually implements the Batch Gradient Descent, Stochastic Gradient Descent and Mini-Batch Gradient Descent algorithms and evaluates a range of values for the learning rate to optimally estimate the coefficients of a linear regression model. The gradient descent path and cost function optimization profiles of the different candidate parameter settings were compared, with the resulting estimated coefficients assessed against those obtained using normal equations which served as the reference baseline values.
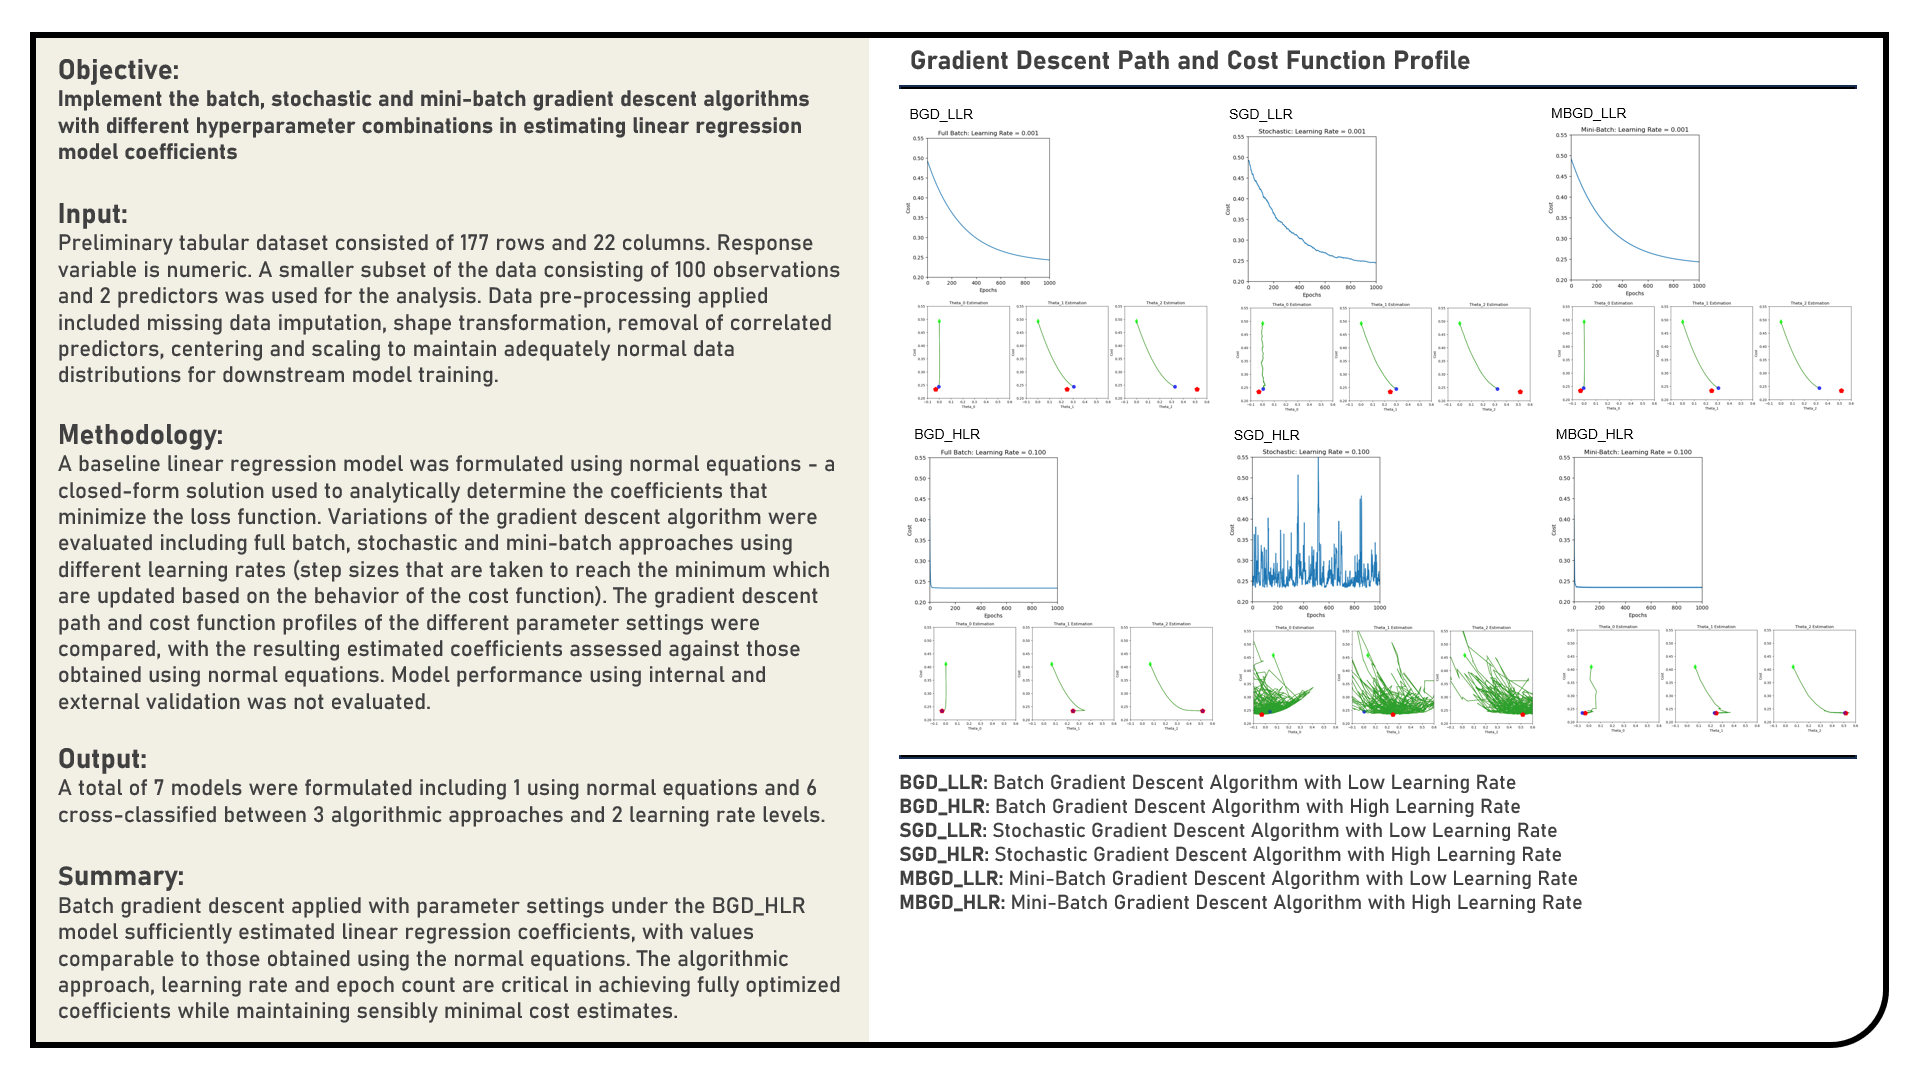
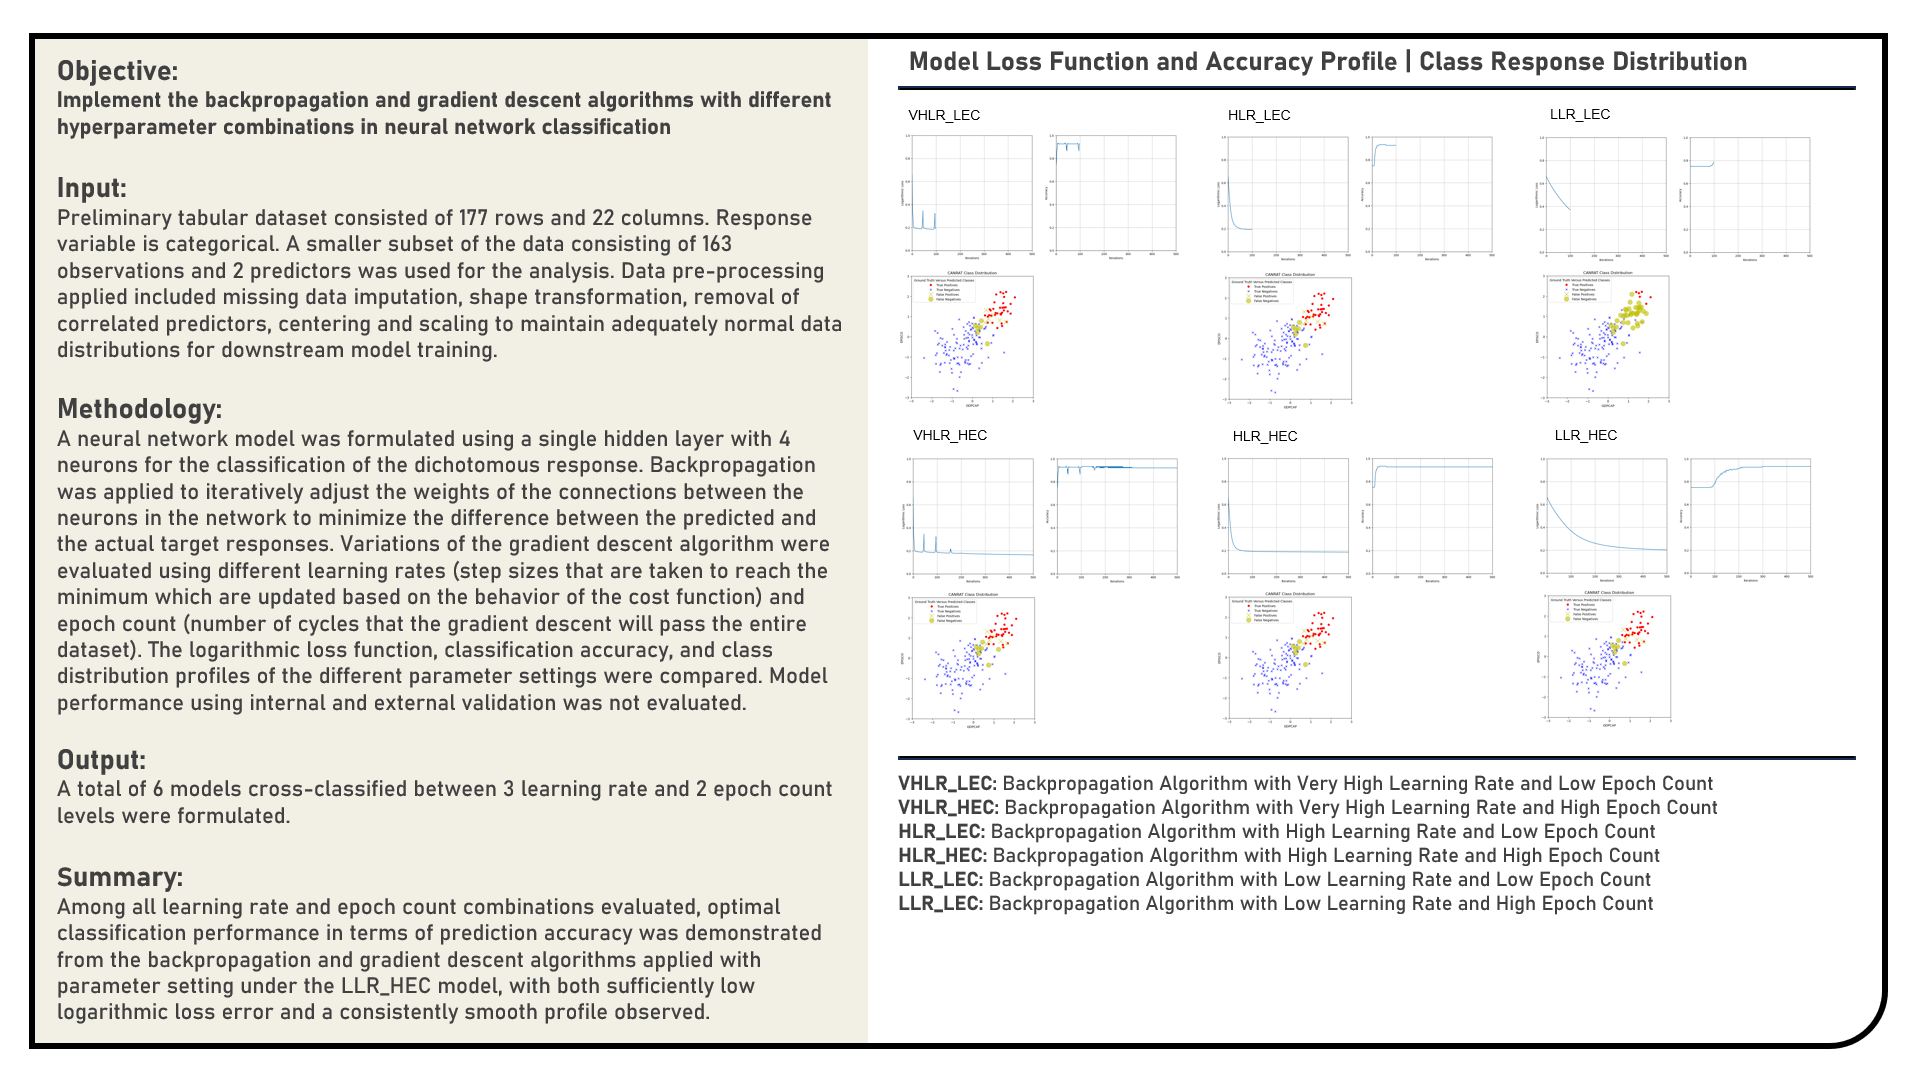
This project manually implements the Backpropagation method to iteratively adjust the weights of the connections between neurons in a neural network classification model. The Gradient Descent algorithm was similarly applied to minimize the difference between the predicted and the actual target responses using a range of values for the learning rate and epoch count parameters. The cost function optimization and classification accuracy profiles of the different candidate parameter settings were compared during epoch training. The class distributions of the resulting predictions were visually evaluated against the target response categories.
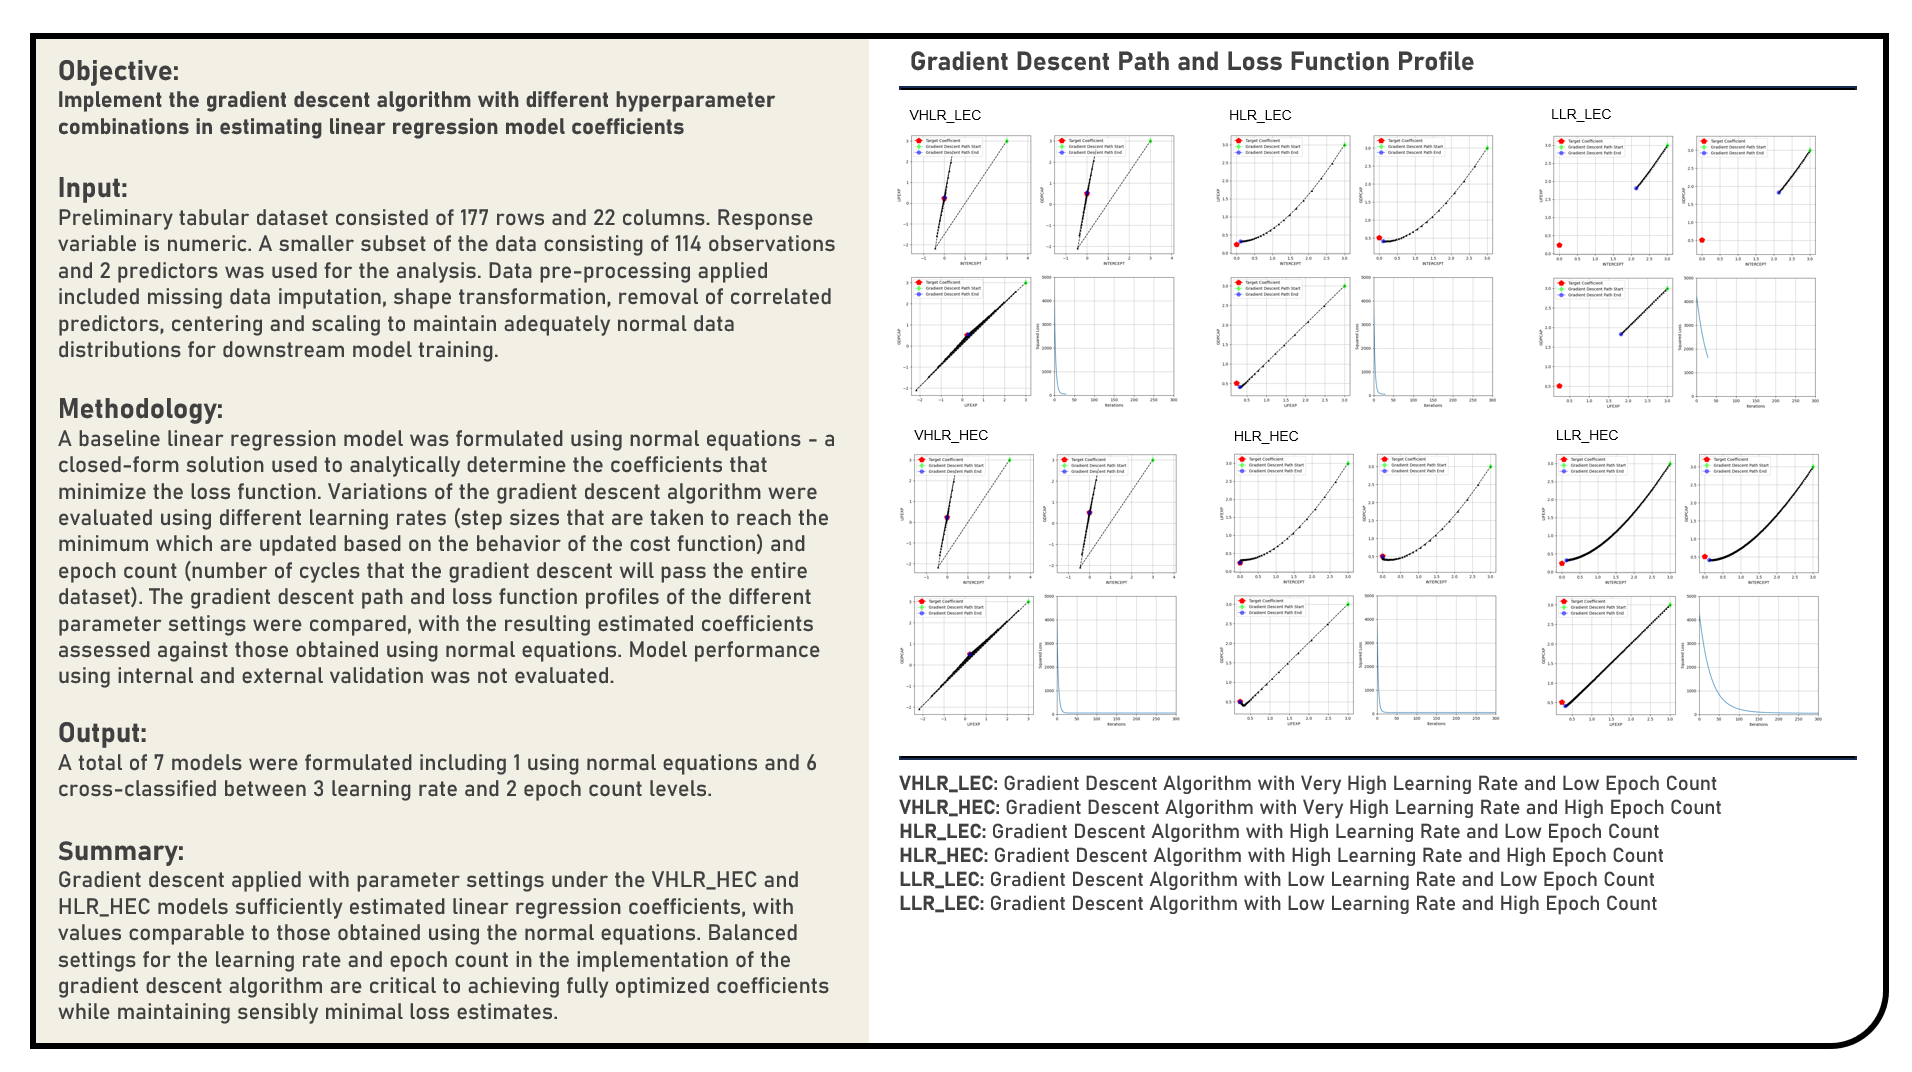
Supervised Learning : Implementing Gradient Descent Algorithm in Estimating Regression Coefficients
This project manually implements the Gradient Descent algorithm and evaluates a range of values for the learning rate and epoch count parameters to optimally estimate the coefficients of a linear regression model. The gradient descent path and loss function profiles of the different candidate parameter settings were compared, with the resulting estimated coefficients assessed against those obtained using normal equations which served as the reference baseline values.
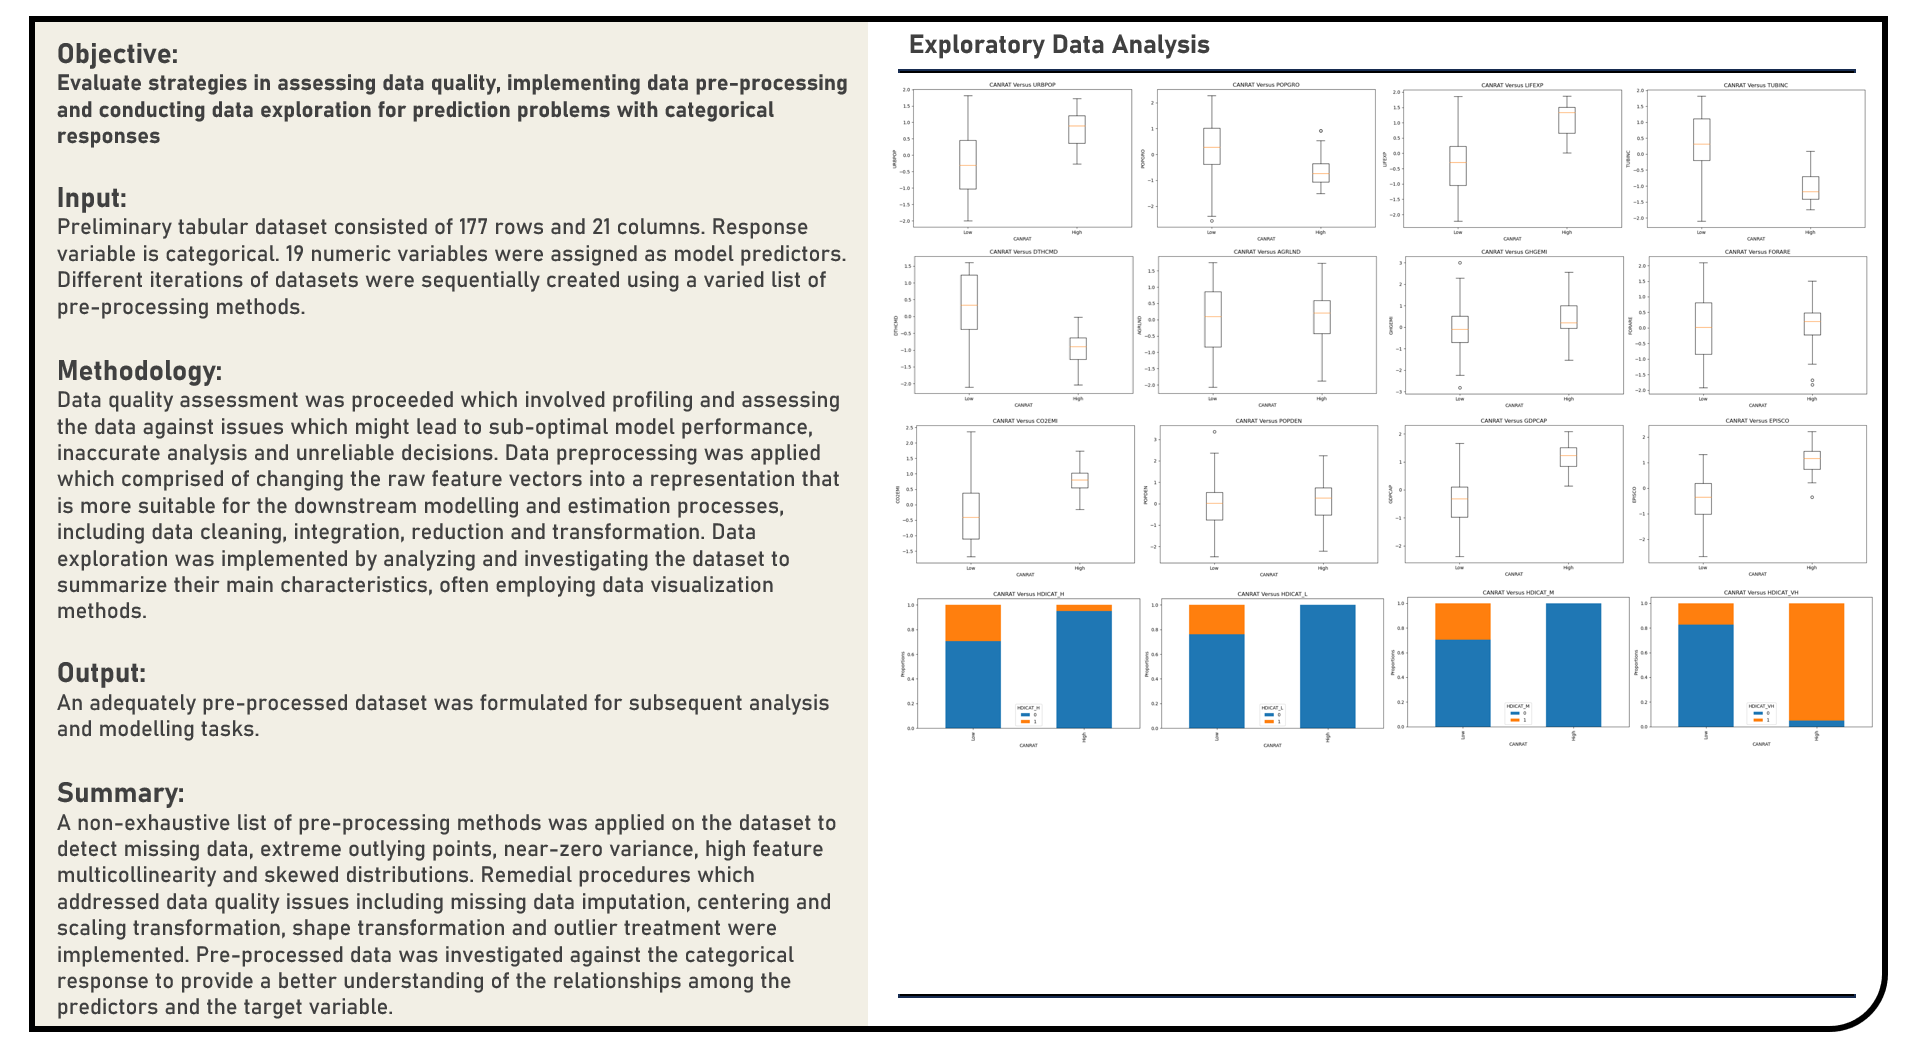
This project explores the various methods in assessing data quality, implementing data preprocessing and conducting exploratory analysis for prediction problems with categorical responses. A non-exhaustive list of methods to detect missing data, extreme outlying points, near-zero variance, multicollinearity and skewed distributions were evaluated. Remedial procedures on addressing data quality issues including missing data imputation, centering and scaling transformation, shape transformation and outlier treatment were similarly considered, as applicable.
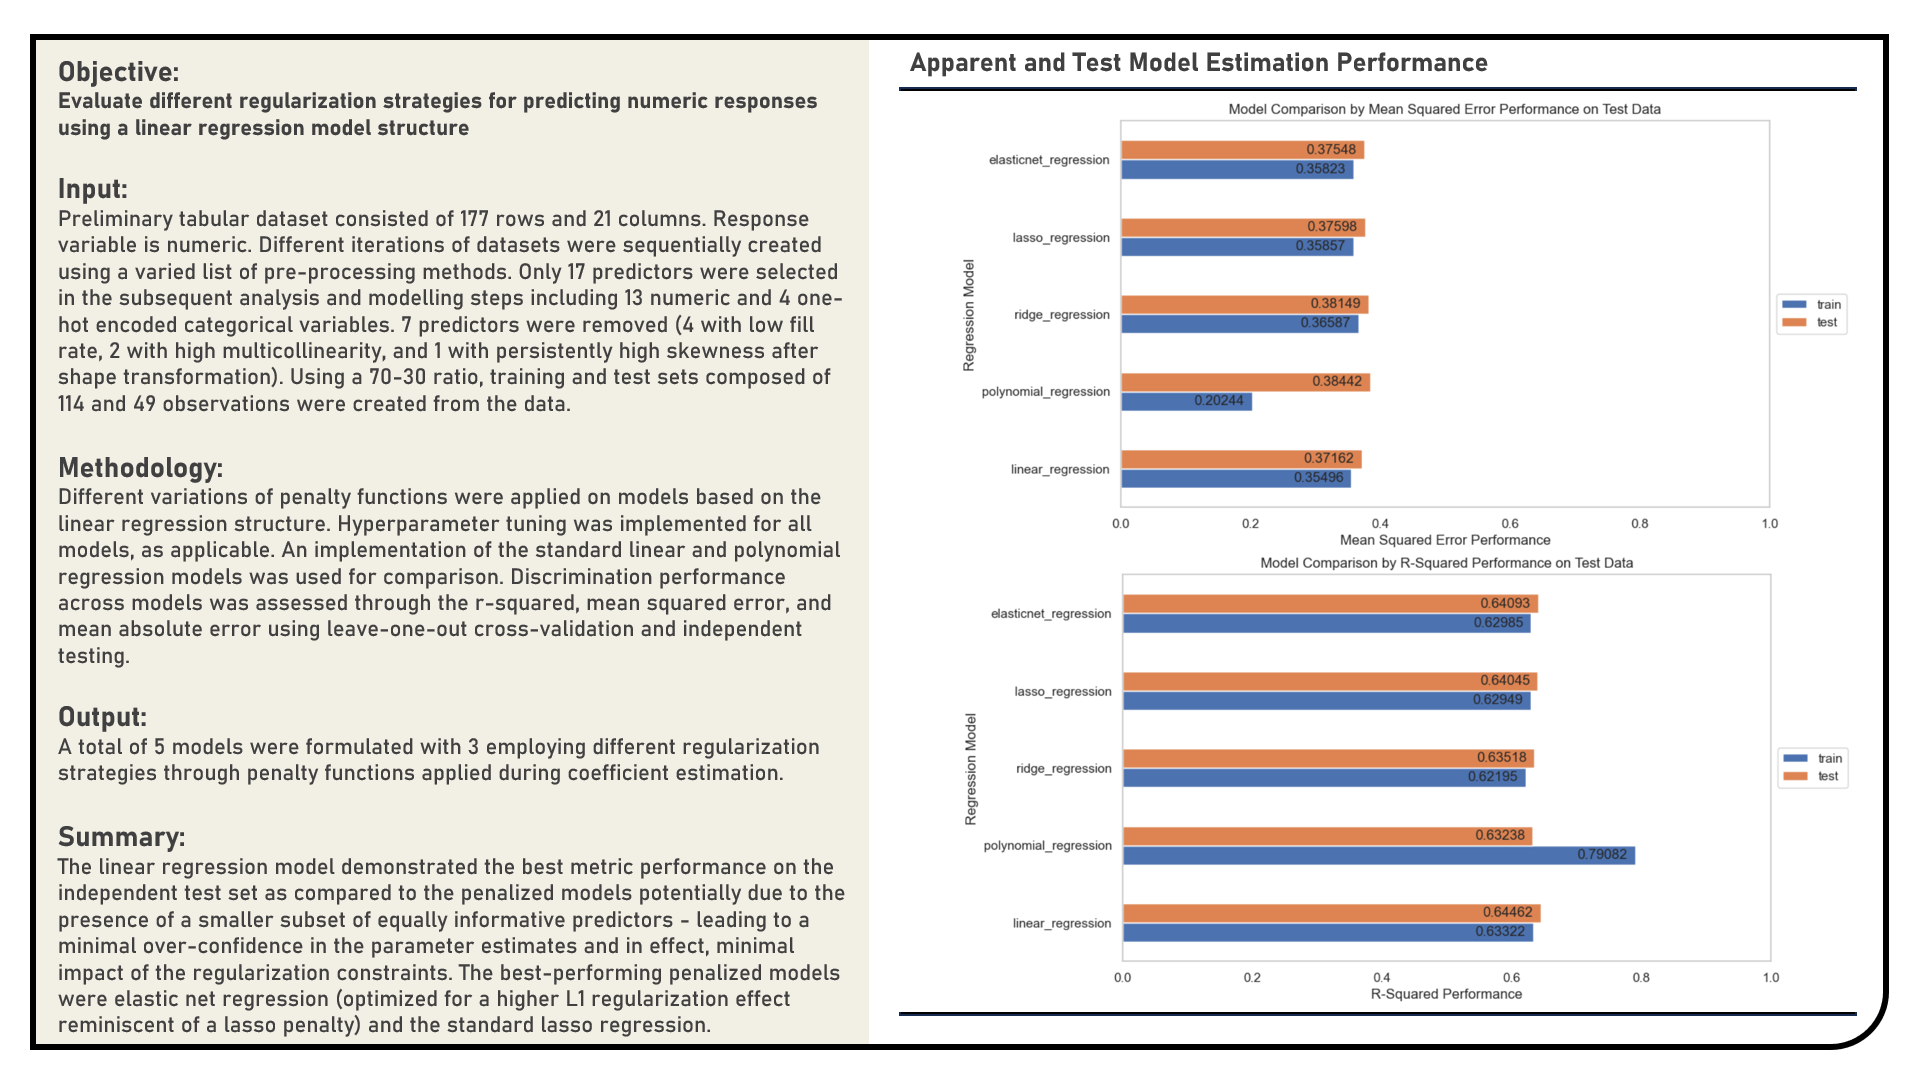
Supervised Learning : Exploring Penalized Models for Predicting Numeric Responses
This project explores the different penalized regression modelling procedures for numeric responses. Using the standard Linear Regression and Polynomial Regression structures as reference, models applied in the analysis which evaluate various penalties for over-confidence in the parameter estimates included the Ridge Regression, Least Absolute Shrinkage and Selection Operator Regression and Elastic Net Regression algorithms. The resulting predictions derived from the candidate models were assessed in terms of their model fit using the r-squared, mean squared error (MSE) and mean absolute error (MAE) metrics.
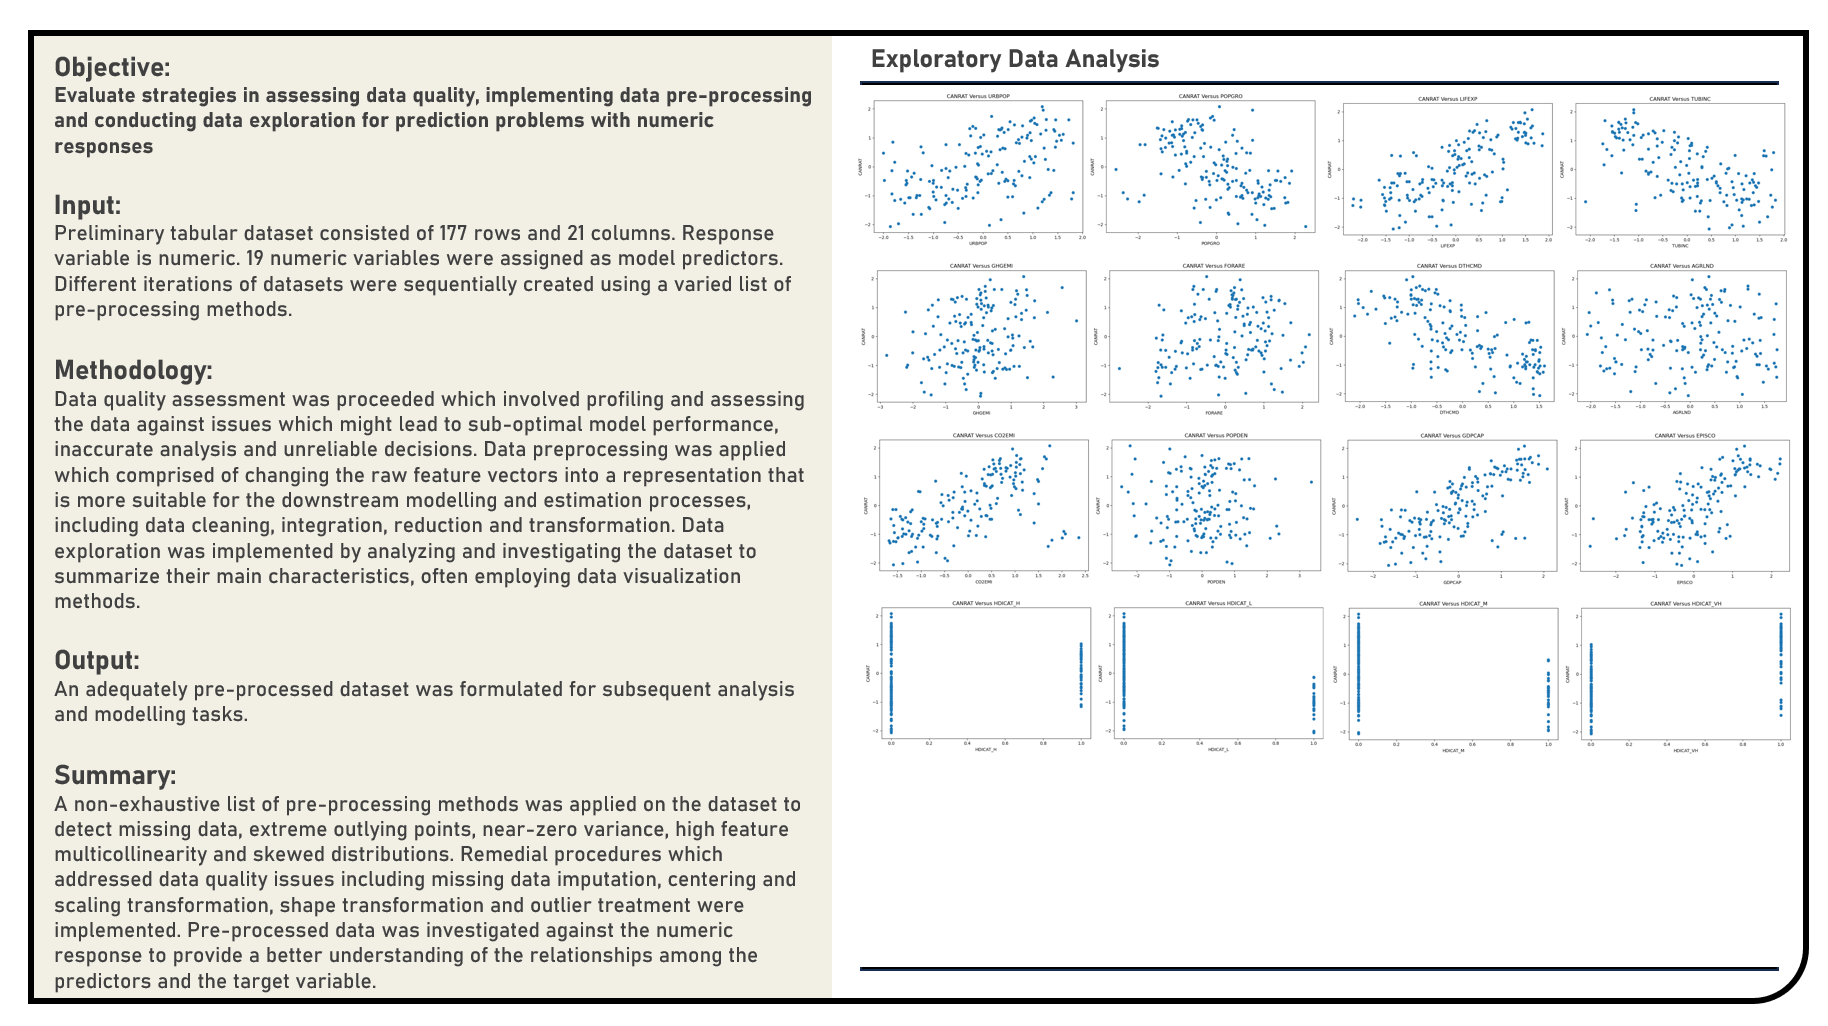
This project explores the various methods in assessing data quality, implementing data preprocessing and conducting exploratory analysis for prediction problems with numeric responses. A non-exhaustive list of methods to detect missing data, extreme outlying points, near-zero variance, multicollinearity and skewed distributions were evaluated. Remedial procedures on addressing data quality issues including missing data imputation, centering and scaling transformation, shape transformation and outlier treatment were similarly considered, as applicable.
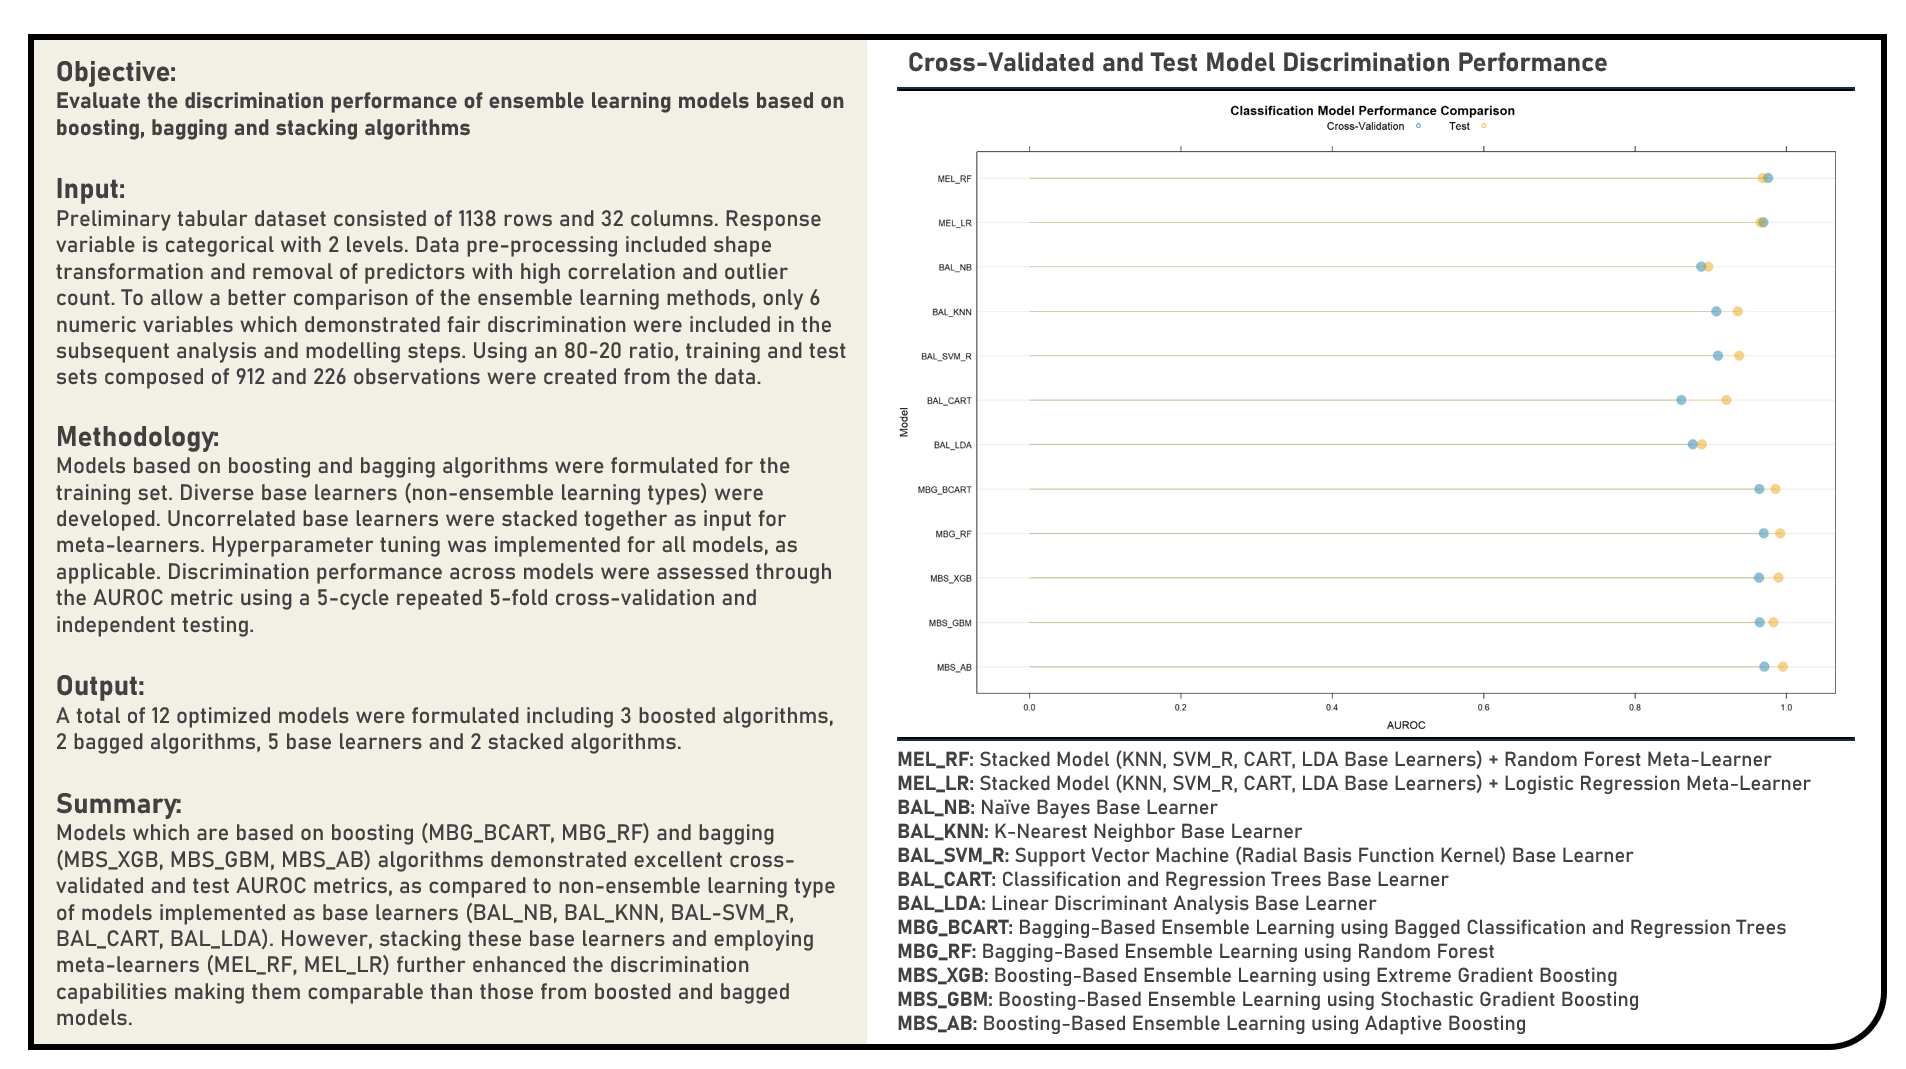
Supervised Learning : Exploring Boosting, Bagging and Stacking Algorithms for Ensemble Learning
This project explores different ensemble learning approaches which combine the predictions from multiple models in an effort to achieve better predictive performance. The ensemble frameworks applied in the analysis were grouped into three classes including boosting models which add ensemble members sequentially that correct the predictions made by prior models and outputs a weighted average of the predictions; bagging models which fit many decision trees on different samples of the same dataset and averaging the predictions; and stacking which consolidate many different models types on the same data and using another model to learn how to best combine the predictions. Boosting models included the Adaptive Boosting, Stochastic Gradient Boosting and Extreme Gradient Boosting algorithms. Bagging models applied were the Random Forest and Bagged Classification and Regression Trees algorithms. Individual base learners including the Linear Discriminant Analysis, Classification and Regression Trees, Support Vector Machine (Radial Basis Function Kernel), K-Nearest Neighbors and Naive Bayes algorithms were evaluated for correlation and stacked together as contributors to the Logistic Regression and Random Forest meta-models. The resulting predictions derived from all ensemble learning models were evaluated based on their discrimination power using the area under the receiver operating characteristics curve (AUROC) metric.
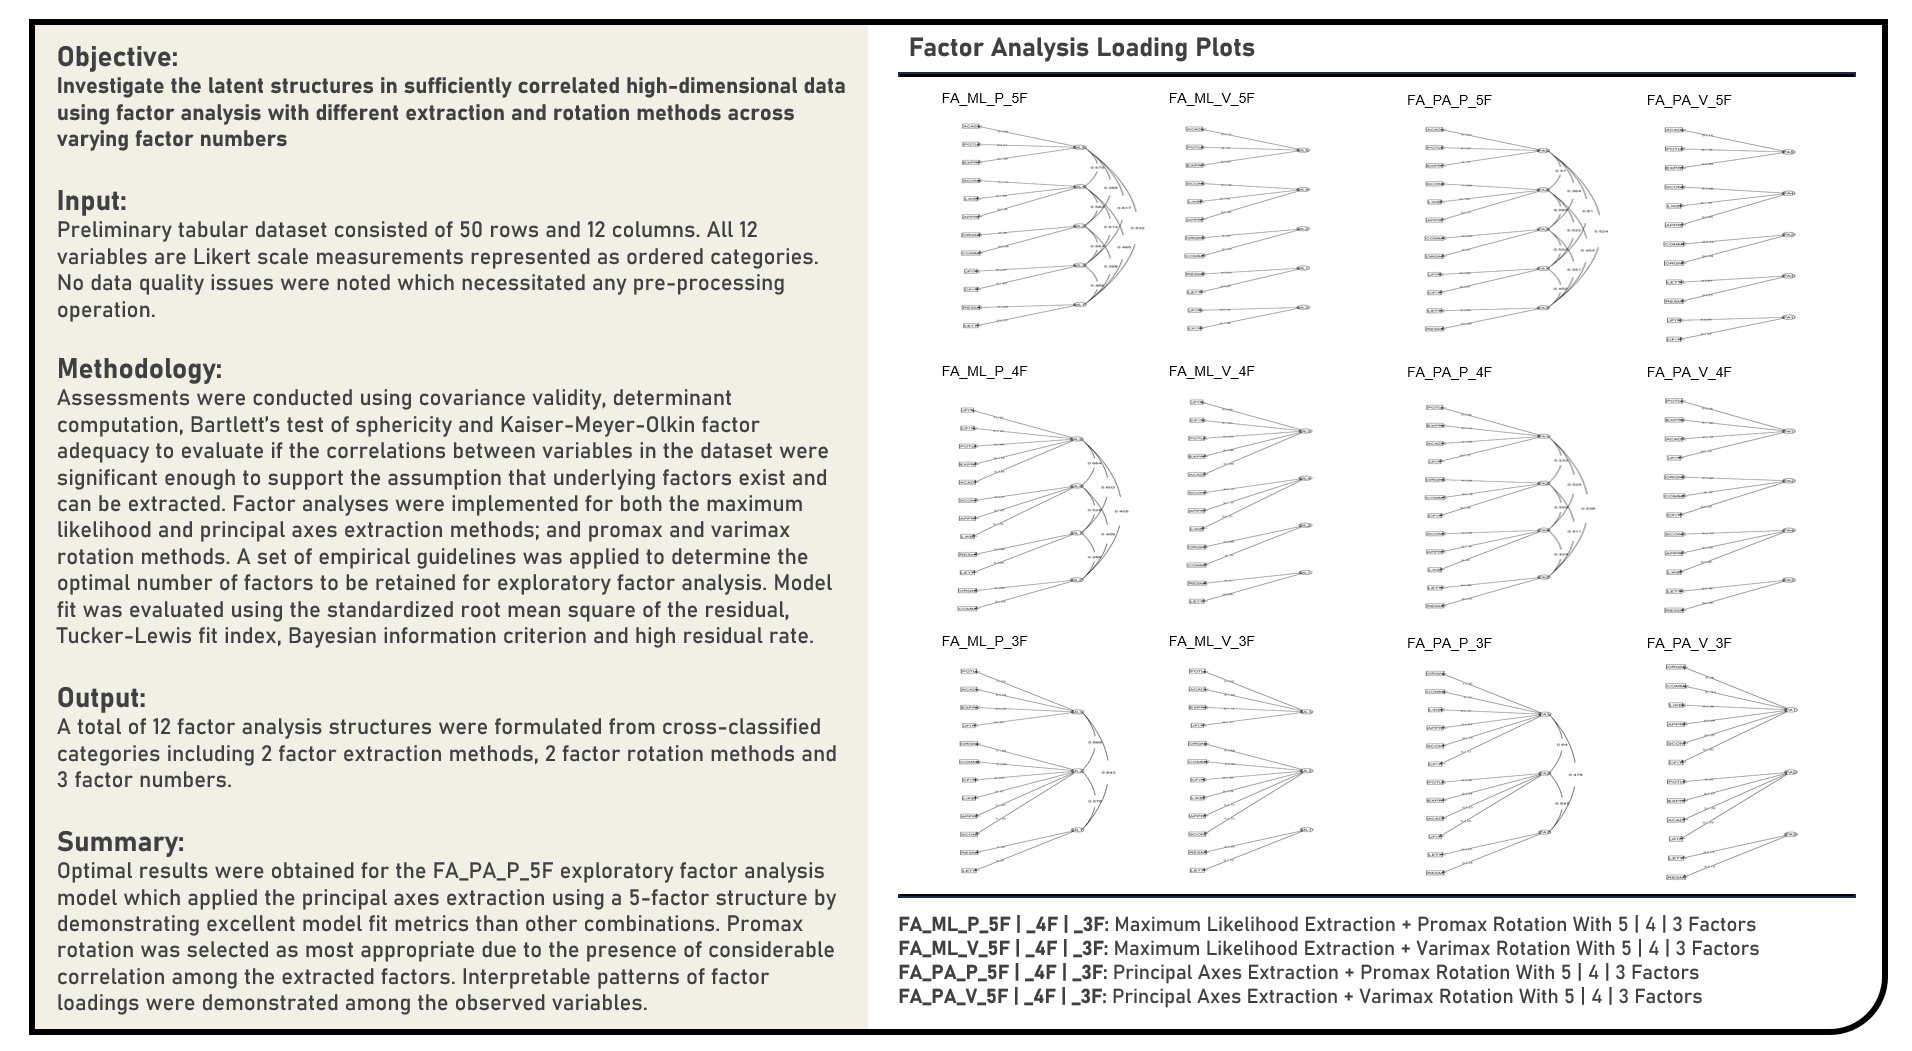
Unsupervised Learning : Discovering Latent Variables in High-Dimensional Data using Exploratory Factor Analysis
This project explores different variations of the exploratory factor analysis method for discovering latent patterns in adequately correlated high-dimensional data. Methods applied in the analysis to estimate and identify potential underlying structures from observed variables included Principal Axes Factor Extraction and Maximum Likelihood Factor Extraction. The approaches used to simplify the derived factor structures to achieve a more interpretable pattern of factor loadings included Varimax Rotation and Promax Rotation. Combinations of the factor extraction and rotation methods were separately applied on the original dataset across different numbers of factors, with the model fit evaluated using the standardized root mean square of the residual, Tucker-Lewis fit index, Bayesian information criterion and high residual rate. The extracted and rotated factors were visualized using the factor loading and dandelion plots.
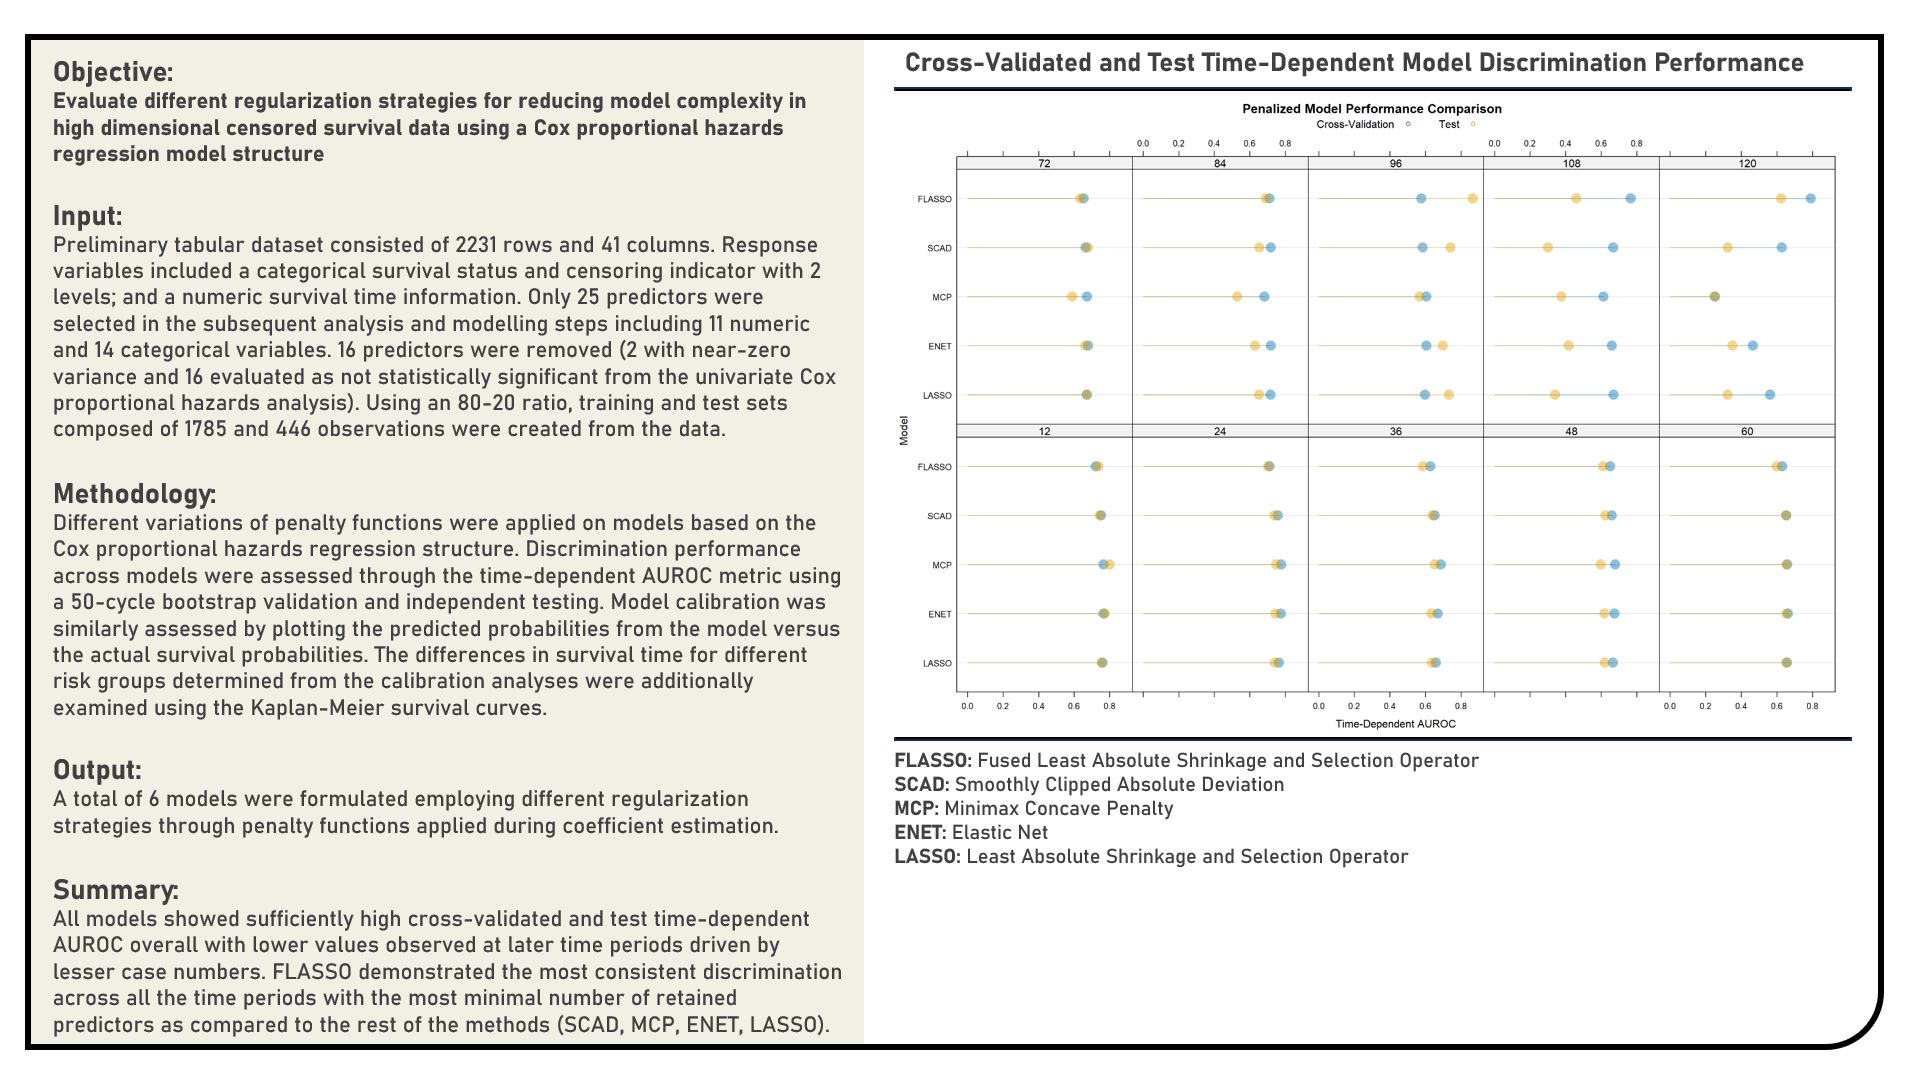
Supervised Learning : Exploring Penalized Models for Handling High-Dimensional Survival Data
This project explores different regularization methods for minimizing model complexity by promoting coefficient sparsity in high-dimensional survival data. Using a Cox Proportional Hazards Regression model structure, penalty functions applied during the coefficient estimation process included the Least Absolute Shrinkage and Selection Operator, Elastic Net, Minimax Concave Penalty, Smoothly Clipped Absolute Deviation and Fused Least Absolute Shrinkage and Selection Operator. The predictive performance for each algorithm was evaluated using the time-dependent area under the receiver operating characteristics curve (AUROC) metric through both internal bootstrap and external validation methods. Model calibration was similarly assessed by plotting the predicted probabilities from the model versus the actual survival probabilities. The differences in survival time for different risk groups determined from the calibration analyses were additionally examined using the Kaplan-Meier survival curves.
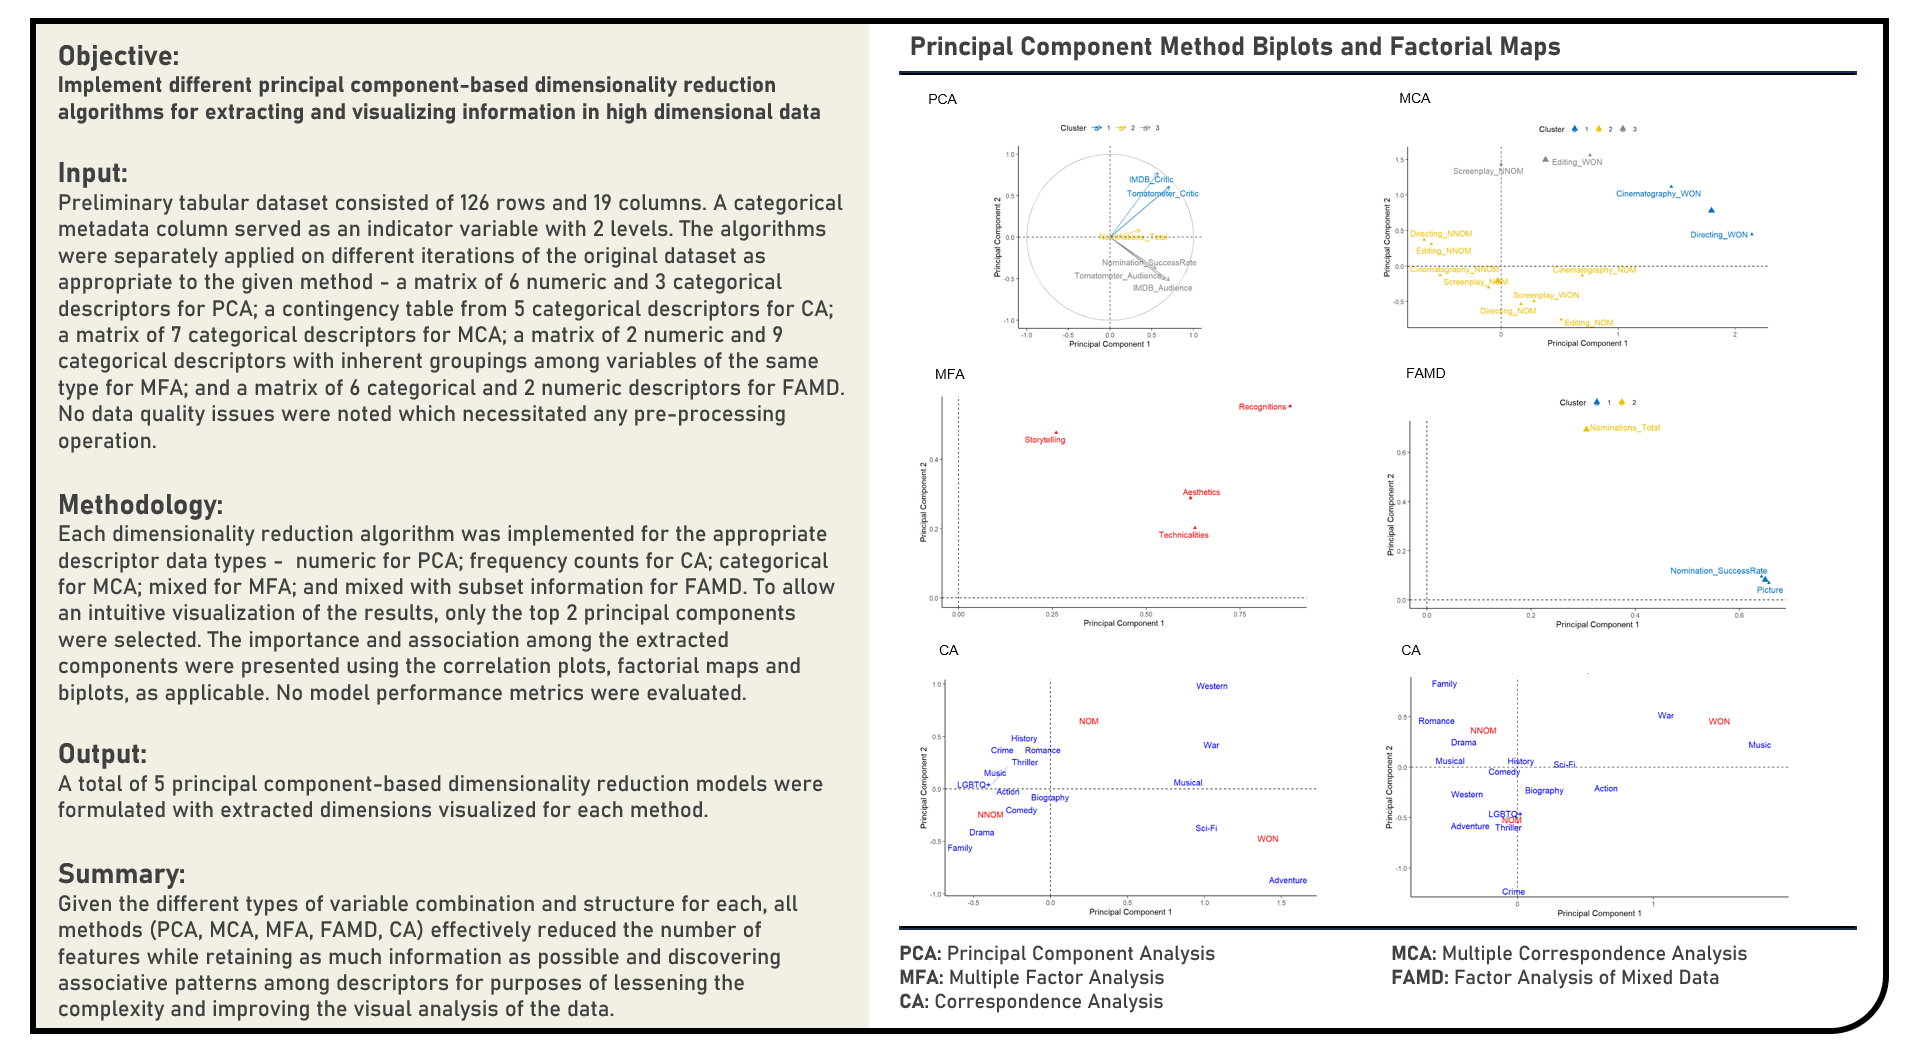
Unsupervised Learning : Exploring and Visualizing Extracted Dimensions from Principal Component Algorithms
This project explores the various principal component-based dimensionality reduction algorithms for extracting and visualizing information. Methods applied in the analysis to transform and reduce high dimensional data included the Principal Component Analysis, Correspondence Analysis, Multiple Correspondence Analysis, Multiple Factor Analysis and Factor Analysis of Mixed Data. The algorithms were separately applied on different iterations of the original dataset as appropriate to the given method, with the correlation plots, factorial maps and biplots (as applicable) formulated for a more intuitive visualization of the extracted dimensions.
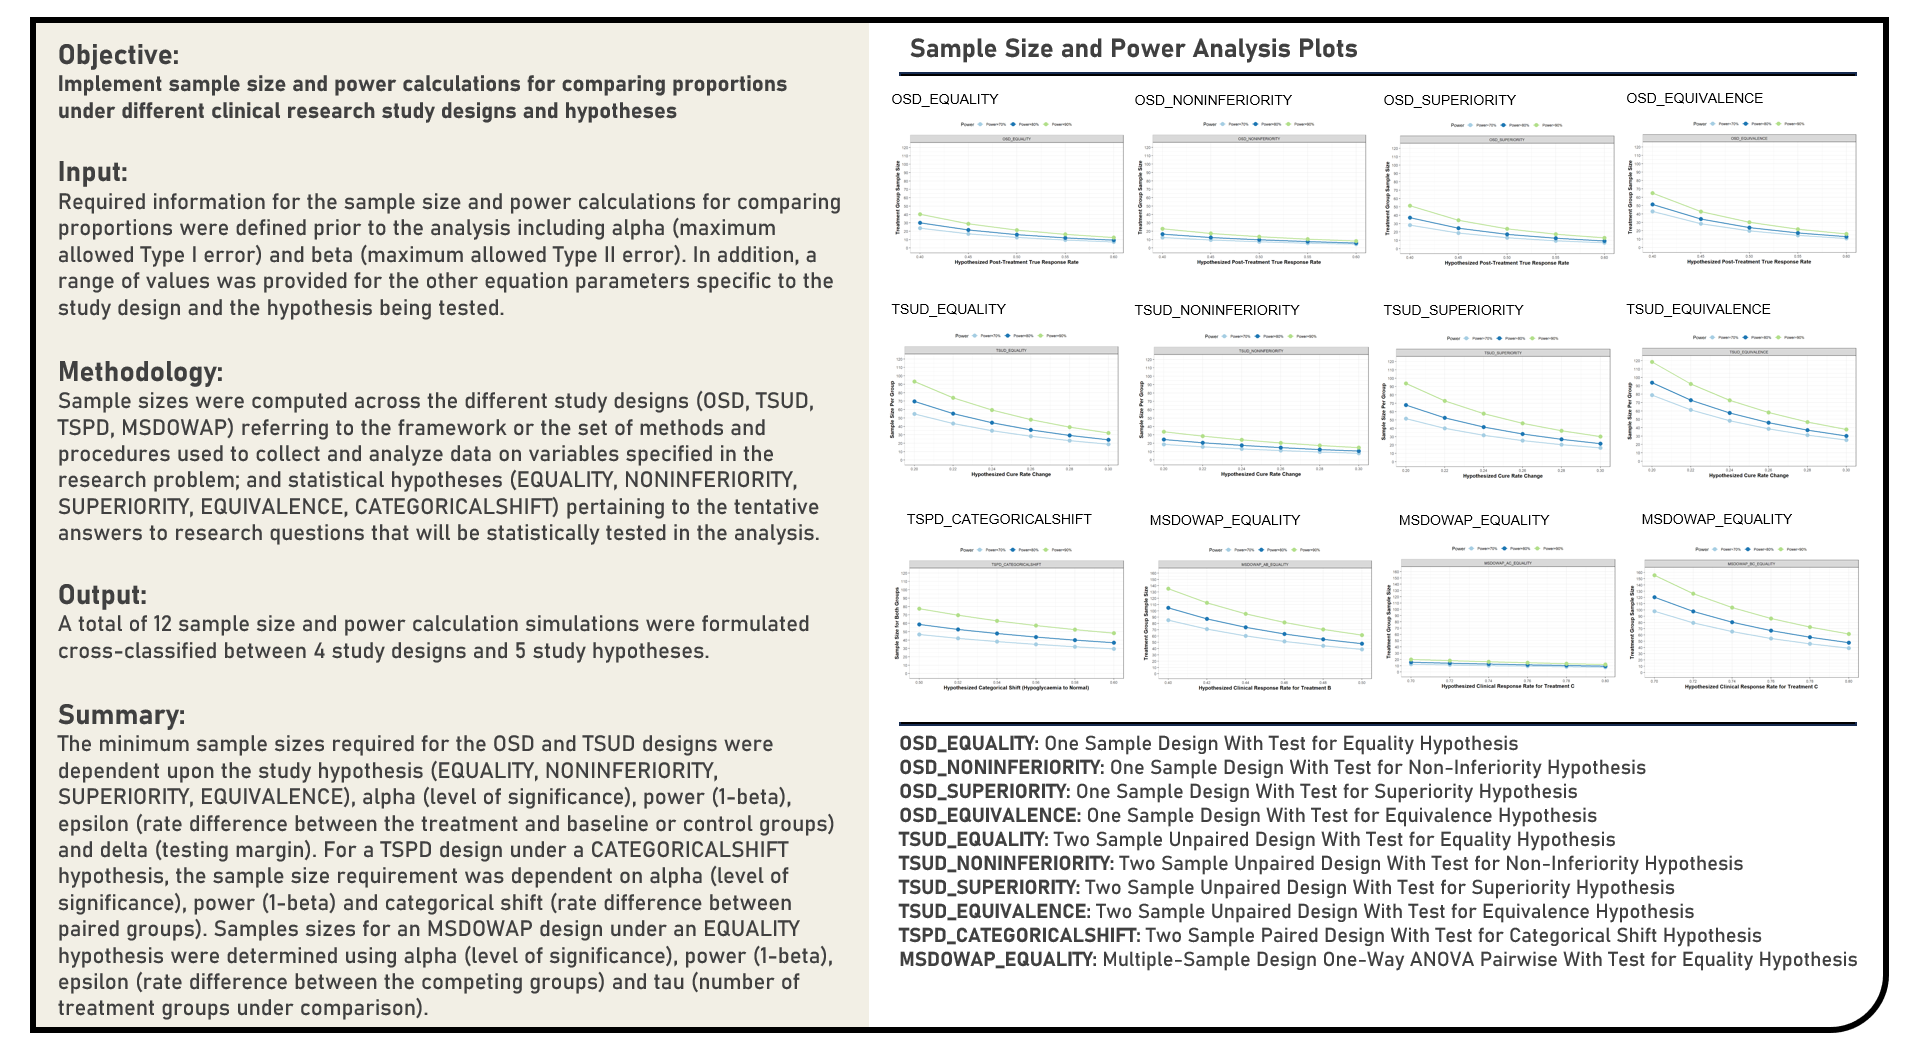
Statistical Evaluation : Sample Size and Power Calculations for Tests Comparing Proportions in Clinical Research
This project explores the various sample size and power calculations for proportion comparison tests in clinical research. The important factors to be assessed prior to determining the appropriate sample sizes were evaluated for the One-Sample, Unpaired Two-Sample, Paired Two-Sample and Multiple-Sample One-Way ANOVA Pairwise Designs. Power analyses were conducted to address the requirements across different study hypotheses including Tests of Equality, Non-Inferiority, Superiority, Equivalence and Categorical Shift.
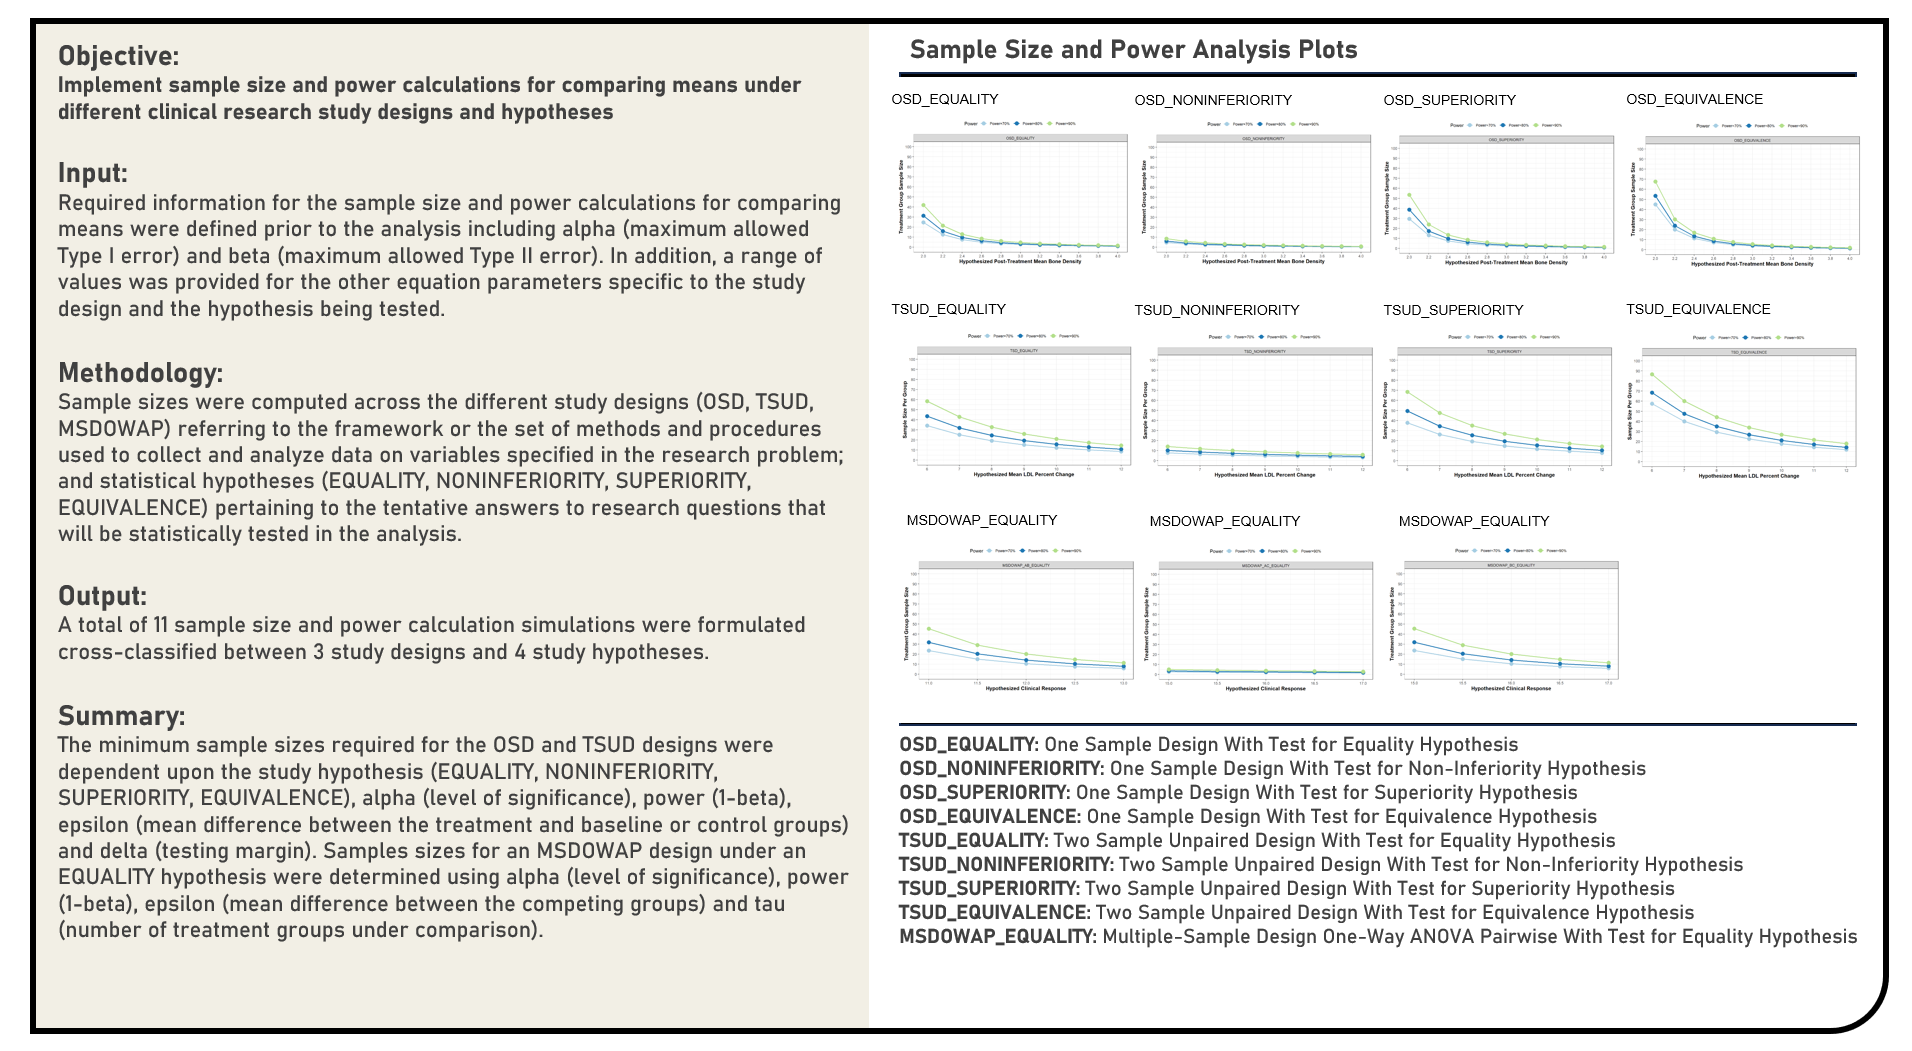
Statistical Evaluation : Sample Size and Power Calculations for Tests Comparing Means in Clinical Research
This project explores the various sample size and power calculations for mean comparison tests in clinical research. The important factors to be assessed prior to determining the appropriate sample sizes were evaluated for the One-Sample, Two-Sample and Multiple-Sample One-Way ANOVA Pairwise Designs. Power analyses were conducted to address the requirements across different study hypotheses including Tests of Equality, Non-Inferiority, Superiority and Equivalence.
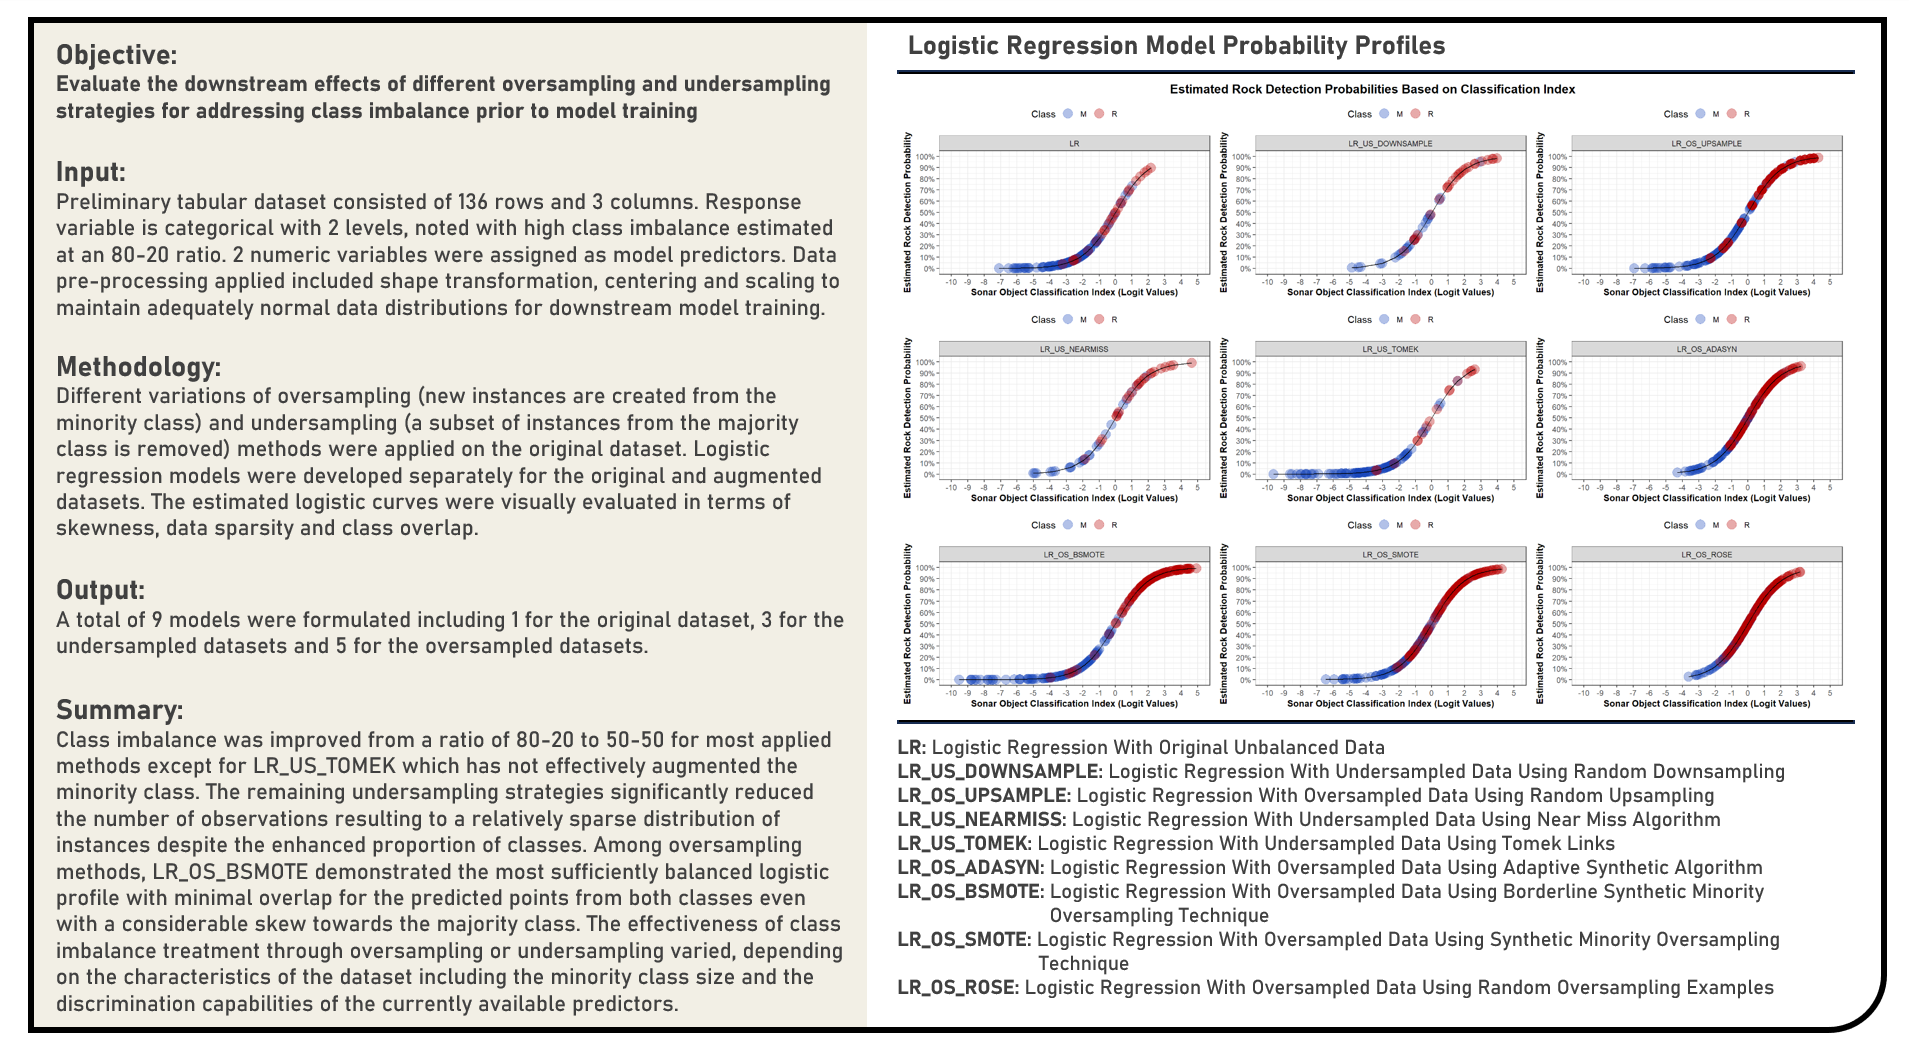
Data Preprocessing : Comparing Oversampling and Undersampling Algorithms for Class Imbalance Treatment
This project explores the various oversampling and undersampling methods to address imbalanced classification problems. The algorithms applied to augment imbalanced data prior to model training by updating the original data set to minimize the effect of the disproportionate ratio of instances in each class included Near Miss, Tomek Links, Adaptive Synthetic Algorithm, Borderline Synthetic Minority Oversampling Technique, Synthetic Minority Oversampling Technique and Random Oversampling Examples. The derived class distributions were compared to the original data set and those applied with both random undersampling and oversampling methods. Using the Logistic Regression model structure, the corresponding logistic curves estimated from both the original and updated data were subjectively assessed in terms of skewness, data sparsity and class overlap. Considering the differences in their intended applications dependent on the quality and characteristics of the data being evaluated, a comparison of each method’s strengths and limitations was briefly discussed.
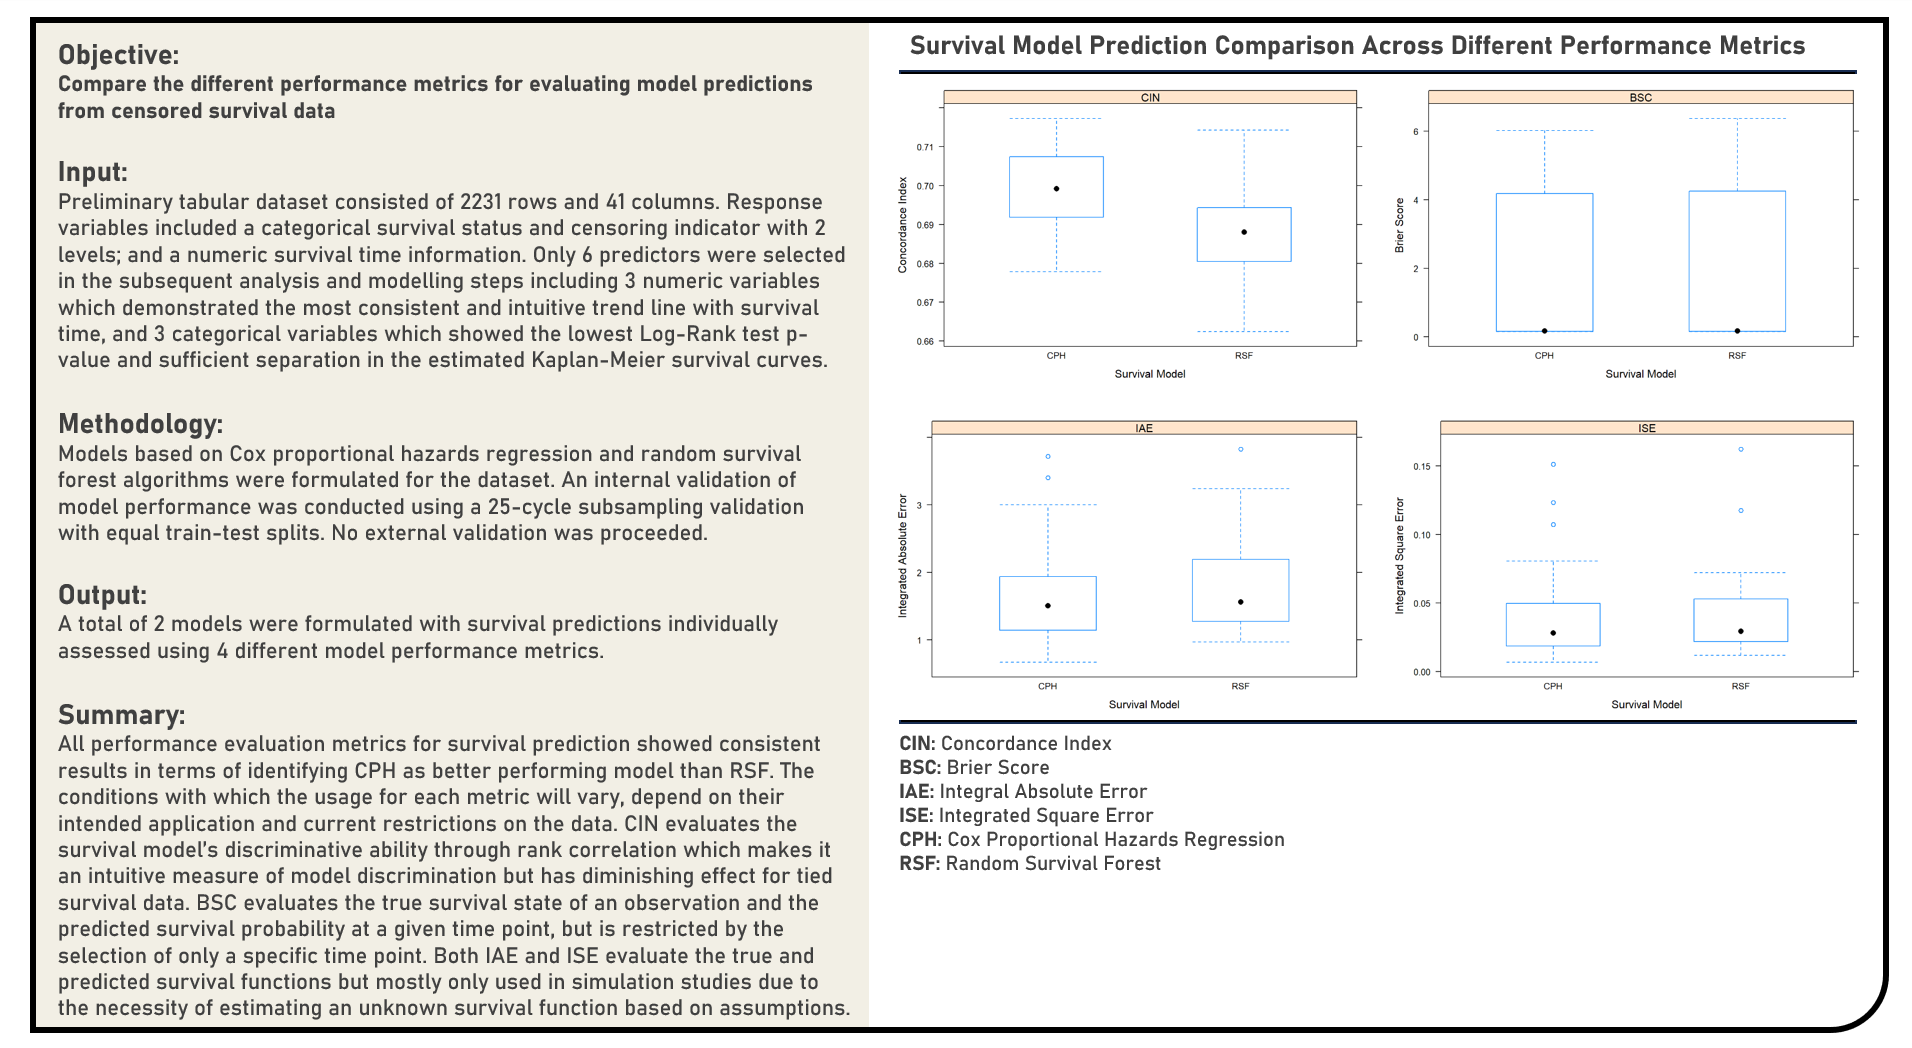
Supervised Learning : Exploring Performance Evaluation Metrics for Survival Prediction
This project explores the various performance metrics which are adaptable to censoring conditions for evaluating survival model predictions. Using the Survival Random Forest and Cox Proportional Hazards Regression model structures, metrics applied in the analysis to estimate the generalization performance of survival models on out-of-sample data included the Concordance Index, Brier Score, Integrated Absolute Error and Integrated Square Error. The resulting split-sample cross-validated estimations derived from the metrics were evaluated in terms of their performance consistency across the candidate models. Considering the differences in their intended applications and current data restrictions, a comparison of each metric’s strengths and limitations was briefly discussed.
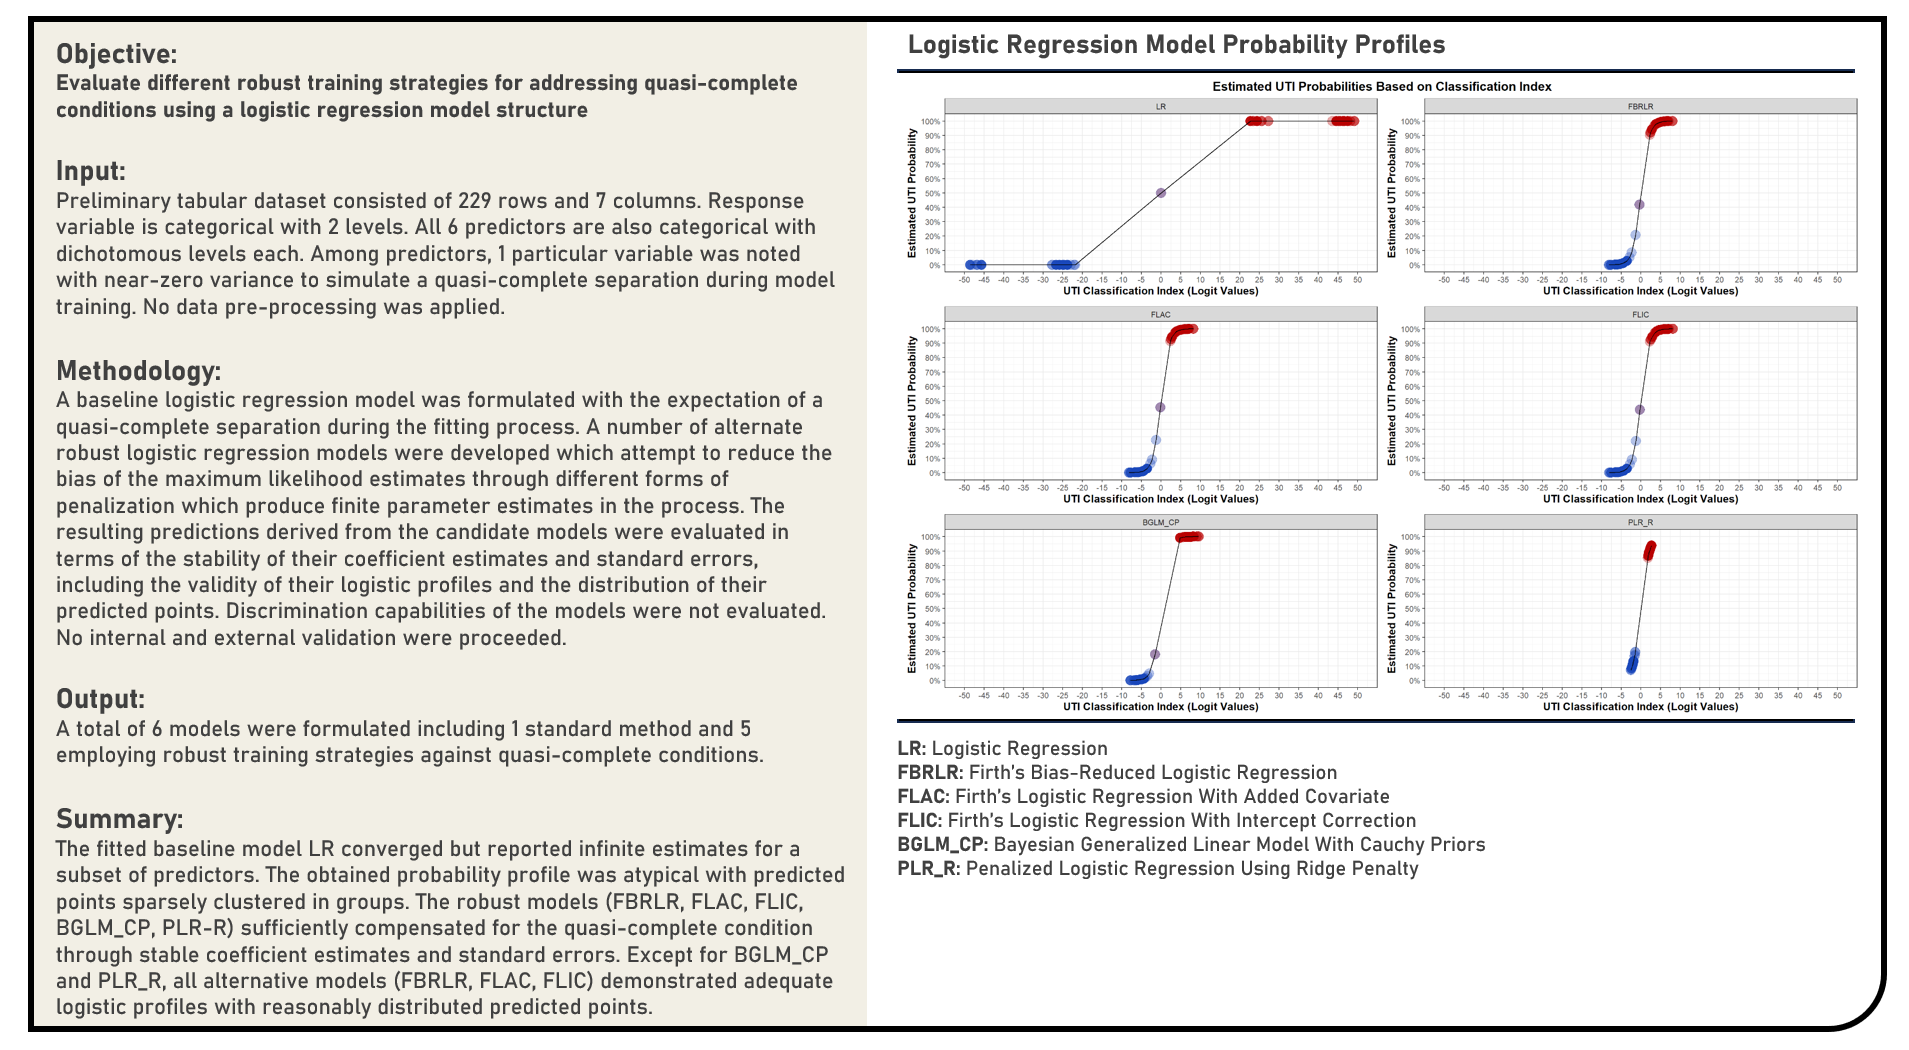
Supervised Learning : Exploring Robust Logistic Regression Models for Handling Quasi-Complete Separation
This project explores the various robust alternatives for handling quasi-complete separation during logistic regression modelling. Methods applied in the analysis to evaluate a quasi-complete condition when a covariate almost perfectly predicts the outcome included the Firth’s Bias-Reduced Logistic Regression, Firth’s Logistic Regression With Added Covariate, Firth’s Logistic Regression With Intercept Correction, Bayesian Generalized Linear Model With Cauchy Priors and Ridge-Penalized Logistic Regression algorithms. The resulting predictions derived from the candidate models were evaluated in terms of the stability of their coefficient estimates and standard errors, including the validity of their logistic profiles and the distribution of their predicted points, which were all compared to that of the baseline model without any form of quasi-complete separation treatment.
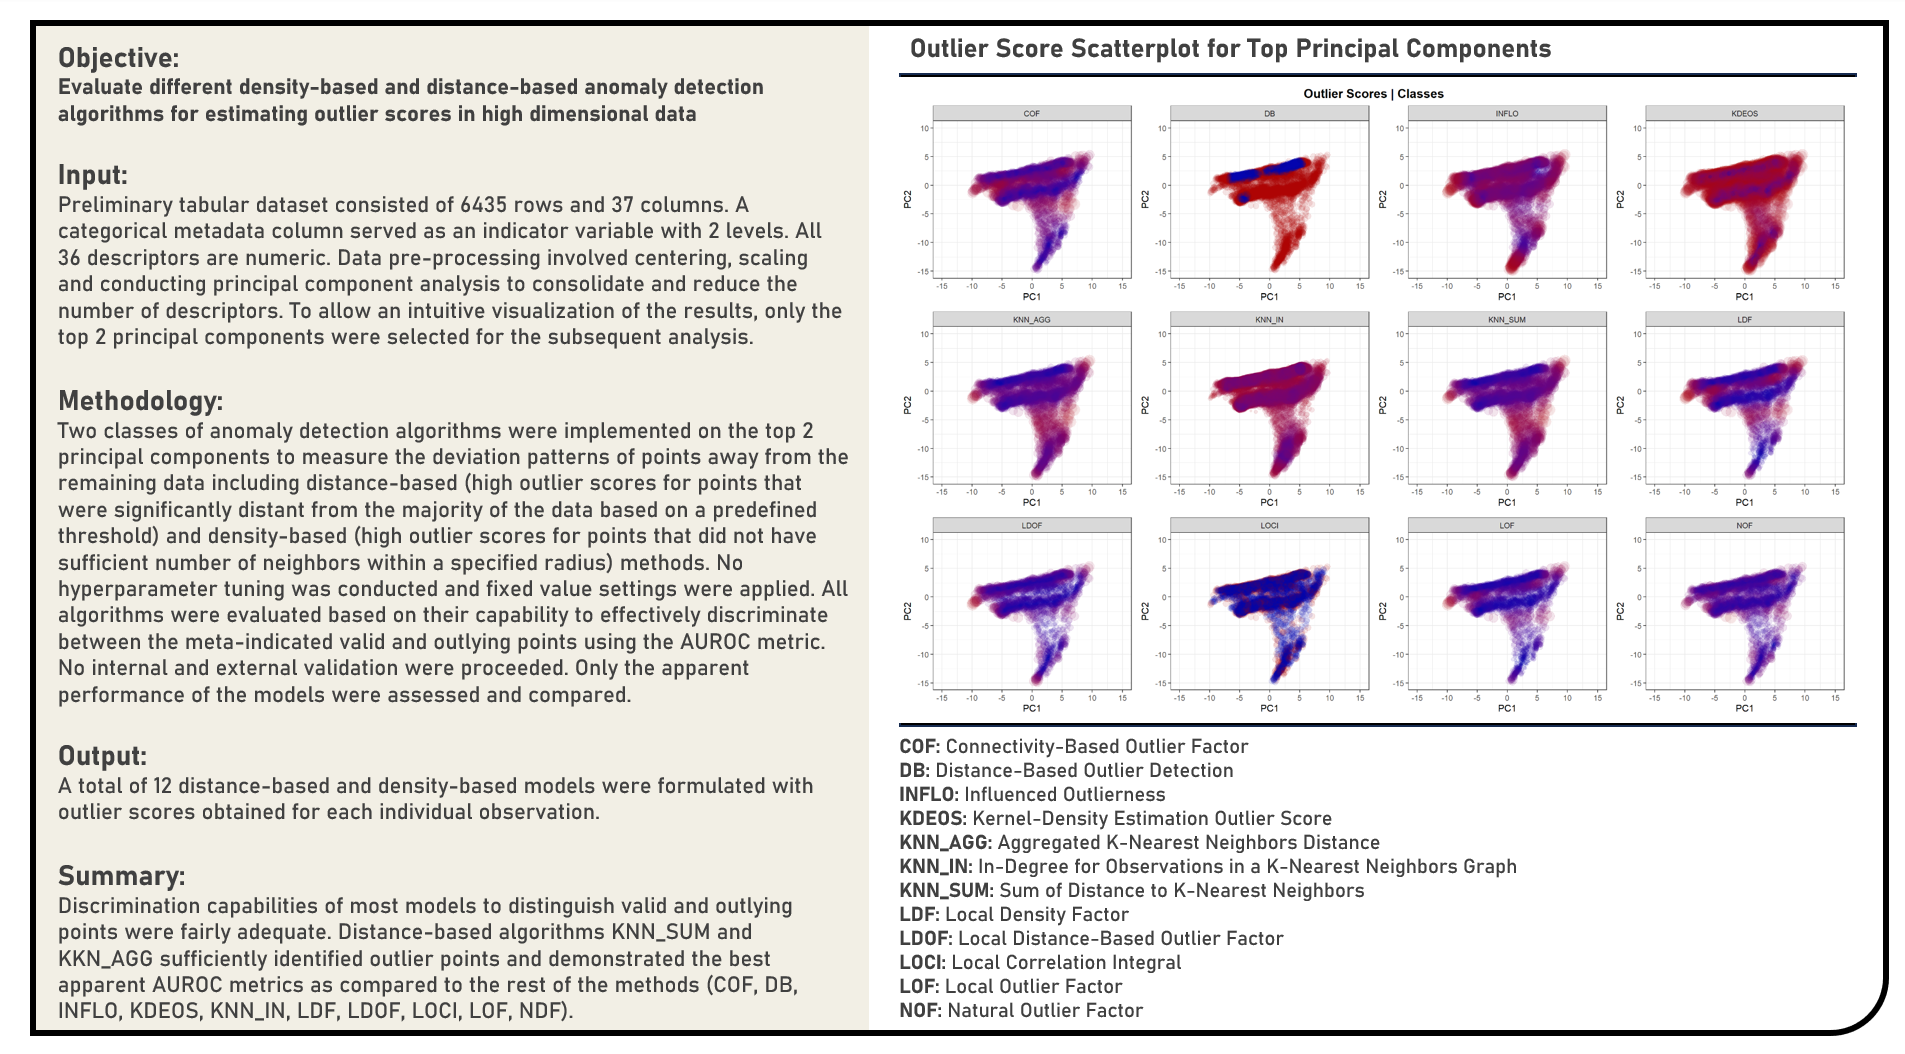
Unsupervised Learning : Estimating Outlier Scores Using Density and Distance-Based Anomaly Detection Algorithms
This project explores the various density and distance-based anomaly detection algorithms for estimating outlier scores. Methods applied in the analysis to identify abnormal points with patterns significantly deviating away from the remaining data included the Connectivity-Based Outlier Factor, Distance-Based Outlier Detection, Influenced Outlierness, Kernel-Density Estimation Outlier Score, Aggregated K-Nearest Neighbors Distance, In-Degree for Observations in a K-Nearest Neighbors Graph, Sum of Distance to K-Nearest Neighbors, Local Density Factor, Local Distance-Based Outlier Factor, Local Correlation Integral, Local Outlier Factor and Natural Outlier Factor algorithms. Using an independent label indicating the valid and outlying points from the data, the different anomaly-detection algorithms were evaluated based on their capability to effectively discriminate both data categories using the area under the receiver operating characteristics curve (AUROC) metric.
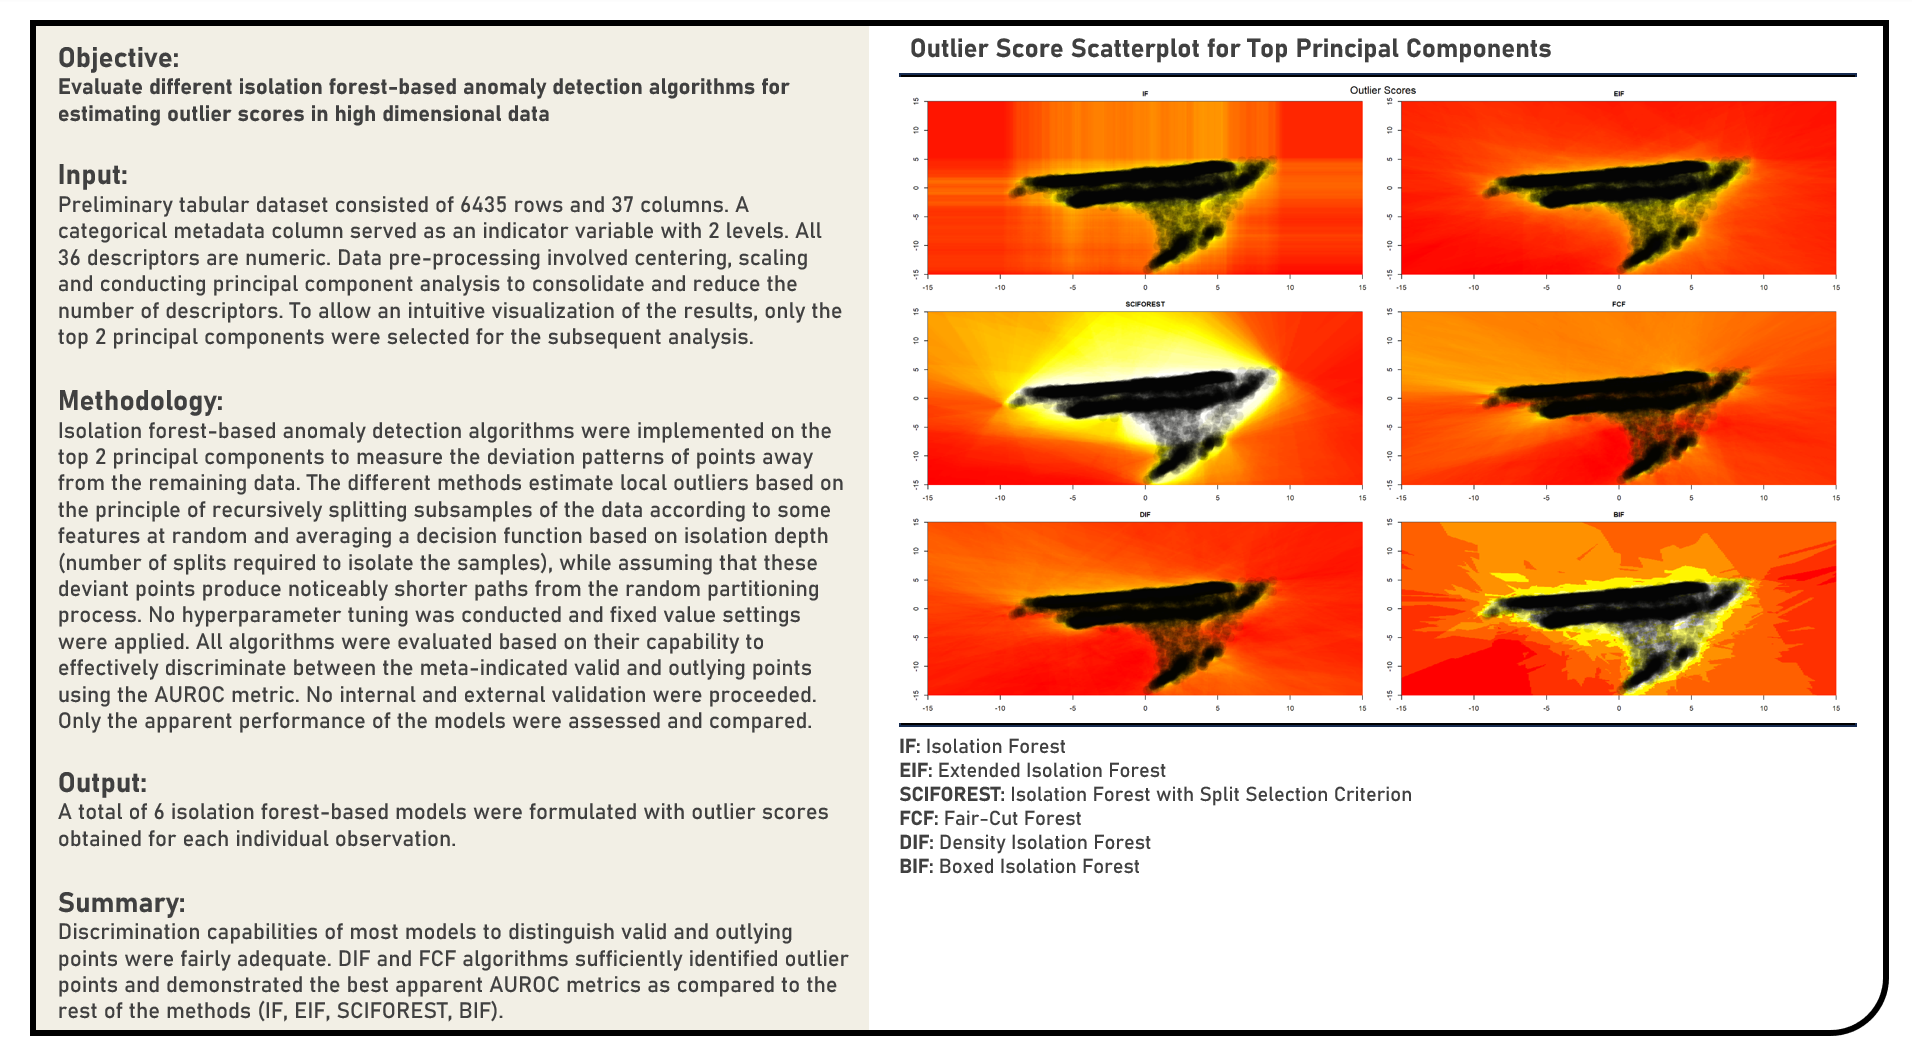
Unsupervised Learning : Estimating Outlier Scores Using Isolation Forest-Based Anomaly Detection Algorithms
This project explores the various isolation forest-based anomaly detection algorithms for estimating outlier scores. Methods applied in the analysis to identify abnormal points with patterns significantly deviating away from the remaining data included the Isolation Forest, Extended Isolation Forest, Isolation Forest with Split Selection Criterion, Fair-Cut Forest, Density Isolation Forest and Boxed Isolation Forest algorithms. Using an independent label indicating the valid and outlying points from the data, the different anomaly-detection algorithms were evaluated based on their capability to effectively discriminate both data categories using the area under the receiver operating characteristics curve (AUROC) metric.
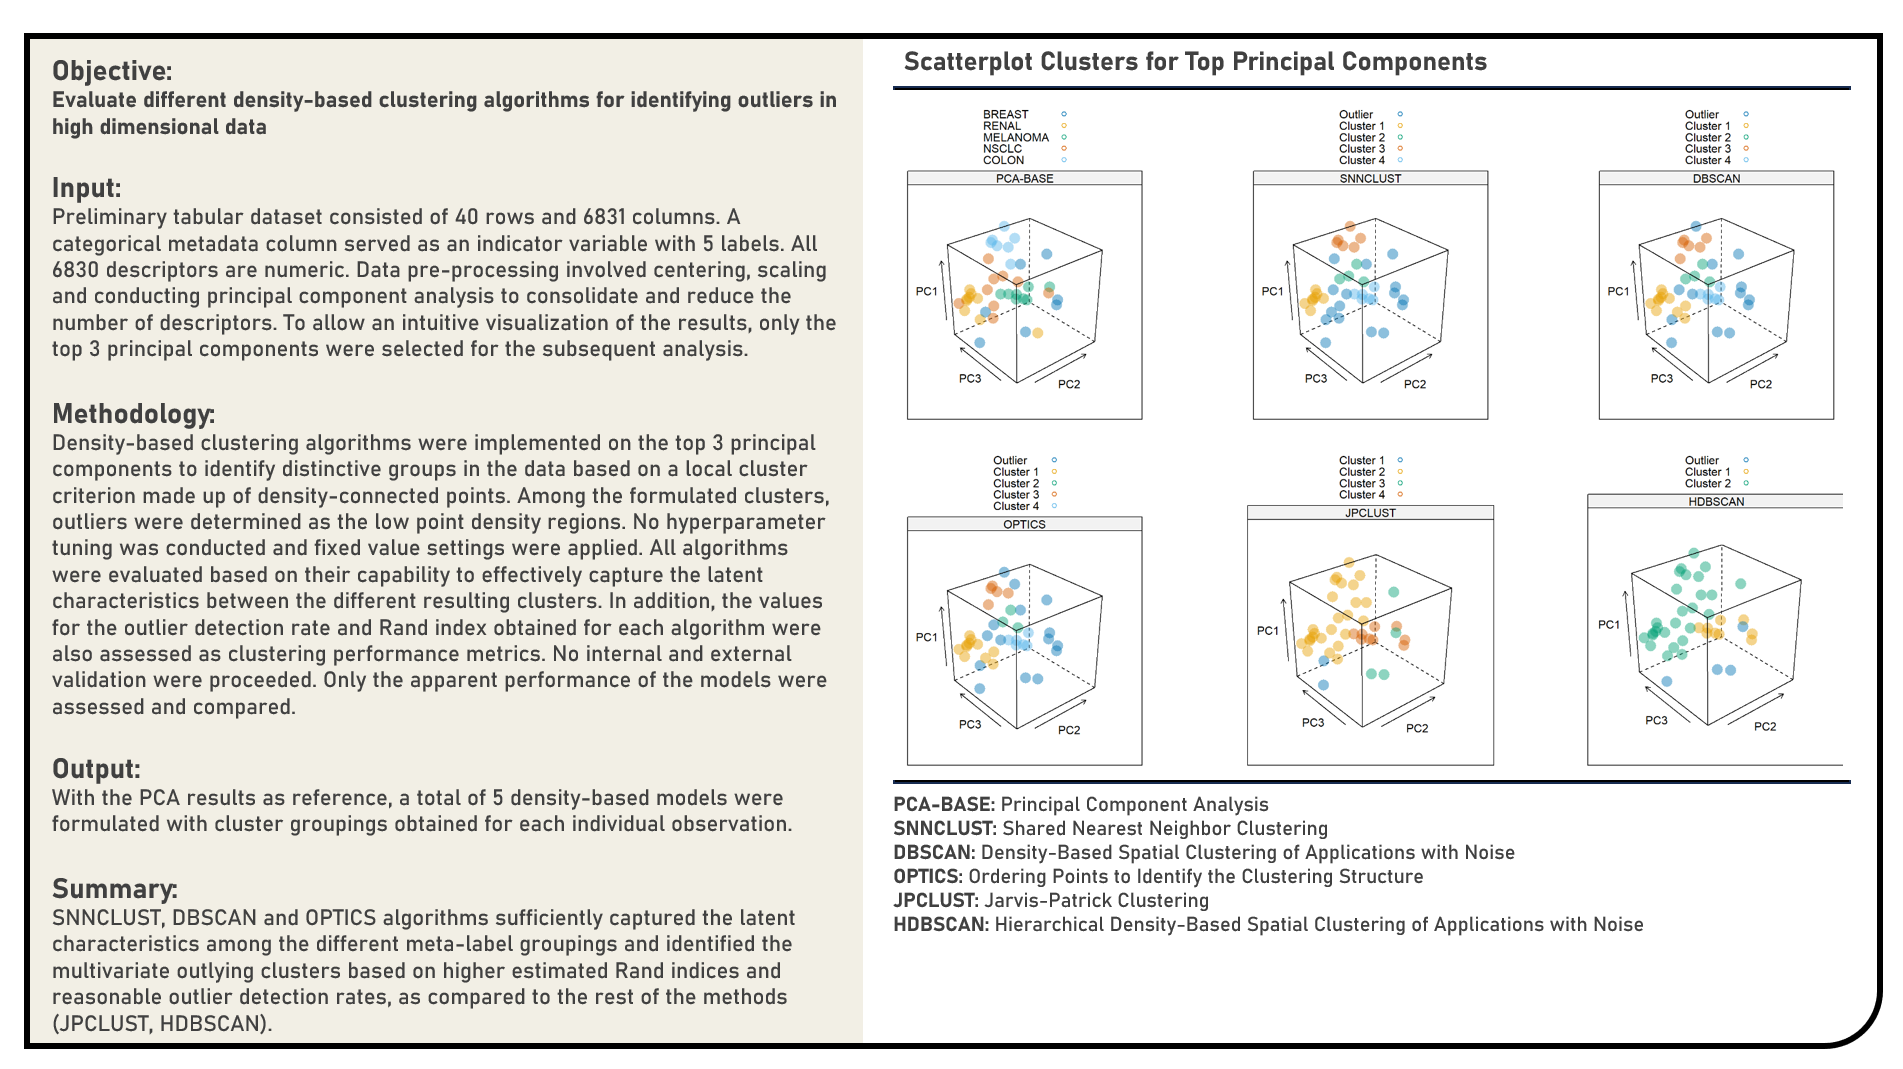
Unsupervised Learning : Identifying Multivariate Outliers Using Density-Based Clustering Algorithms
This project explores the various density-based clustering algorithms for identifying multivariate outliers. Methods applied in the analysis to cluster points and detect outliers from high dimensional data included the Density-Based Spatial Clustering of Applications with Noise, Hierarchical Density-Based Spatial Clustering of Applications with Noise, Ordering Points to Identify the Clustering Structure, Jarvis-Patrick Clustering and Shared Nearest Neighbor Clustering algorithms. The different clustering algorithms were subjectively evaluated based on their capability to effectively capture the latent characteristics between the different resulting clusters. In addition, the values for the outlier detection rate and Rand index obtained for each algorithm were also assessed for an objective comparison of their clustering performance.
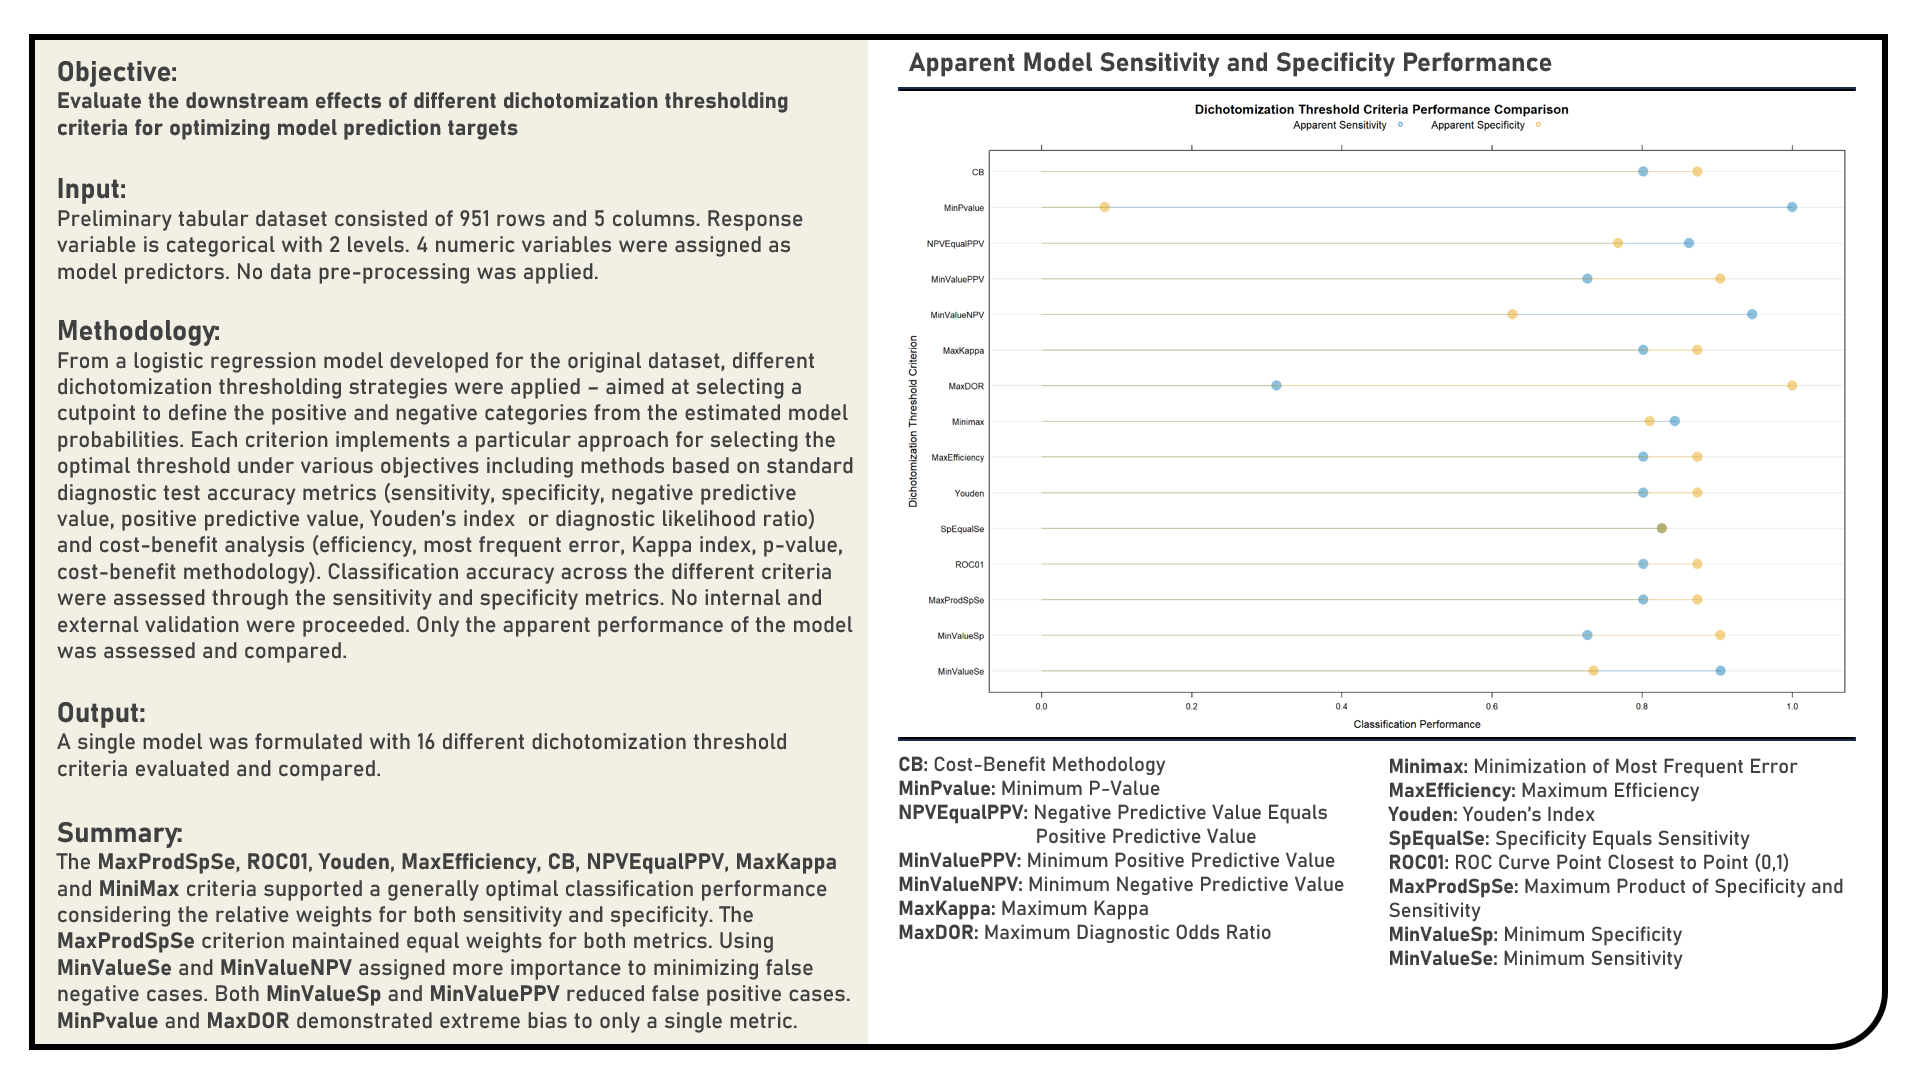
Supervised Learning : Exploring Dichotomization Thresholding Strategies for Optimal Classification
This project explores the various dichotomization thresholding strategies for optimally classifying categorical responses. Using a Logistic Regression model structure, threshold criteria applied in the analysis to support optimal class prediction included Minimum Sensitivity, Minimum Specificity, Maximum Product of Specificity and Sensitivity, ROC Curve Point Closest to Point (0,1), Sensitivity Equals Specificity, Youden’s Index, Maximum Efficiency, Minimization of Most Frequent Error, Maximum Diagnostic Odds Ratio, Maximum Kappa, Minimum Negative Predictive Value, Minimum Positive Predictive Value, Negative Predictive Value Equals Positive Predictive Value, Minimum P-Value and Cost-Benefit Methodology. The optimal thresholds determined for all criteria were compared and evaluated in terms of their relevance to the sensitivity and specificity objectives of the classification problem at hand.
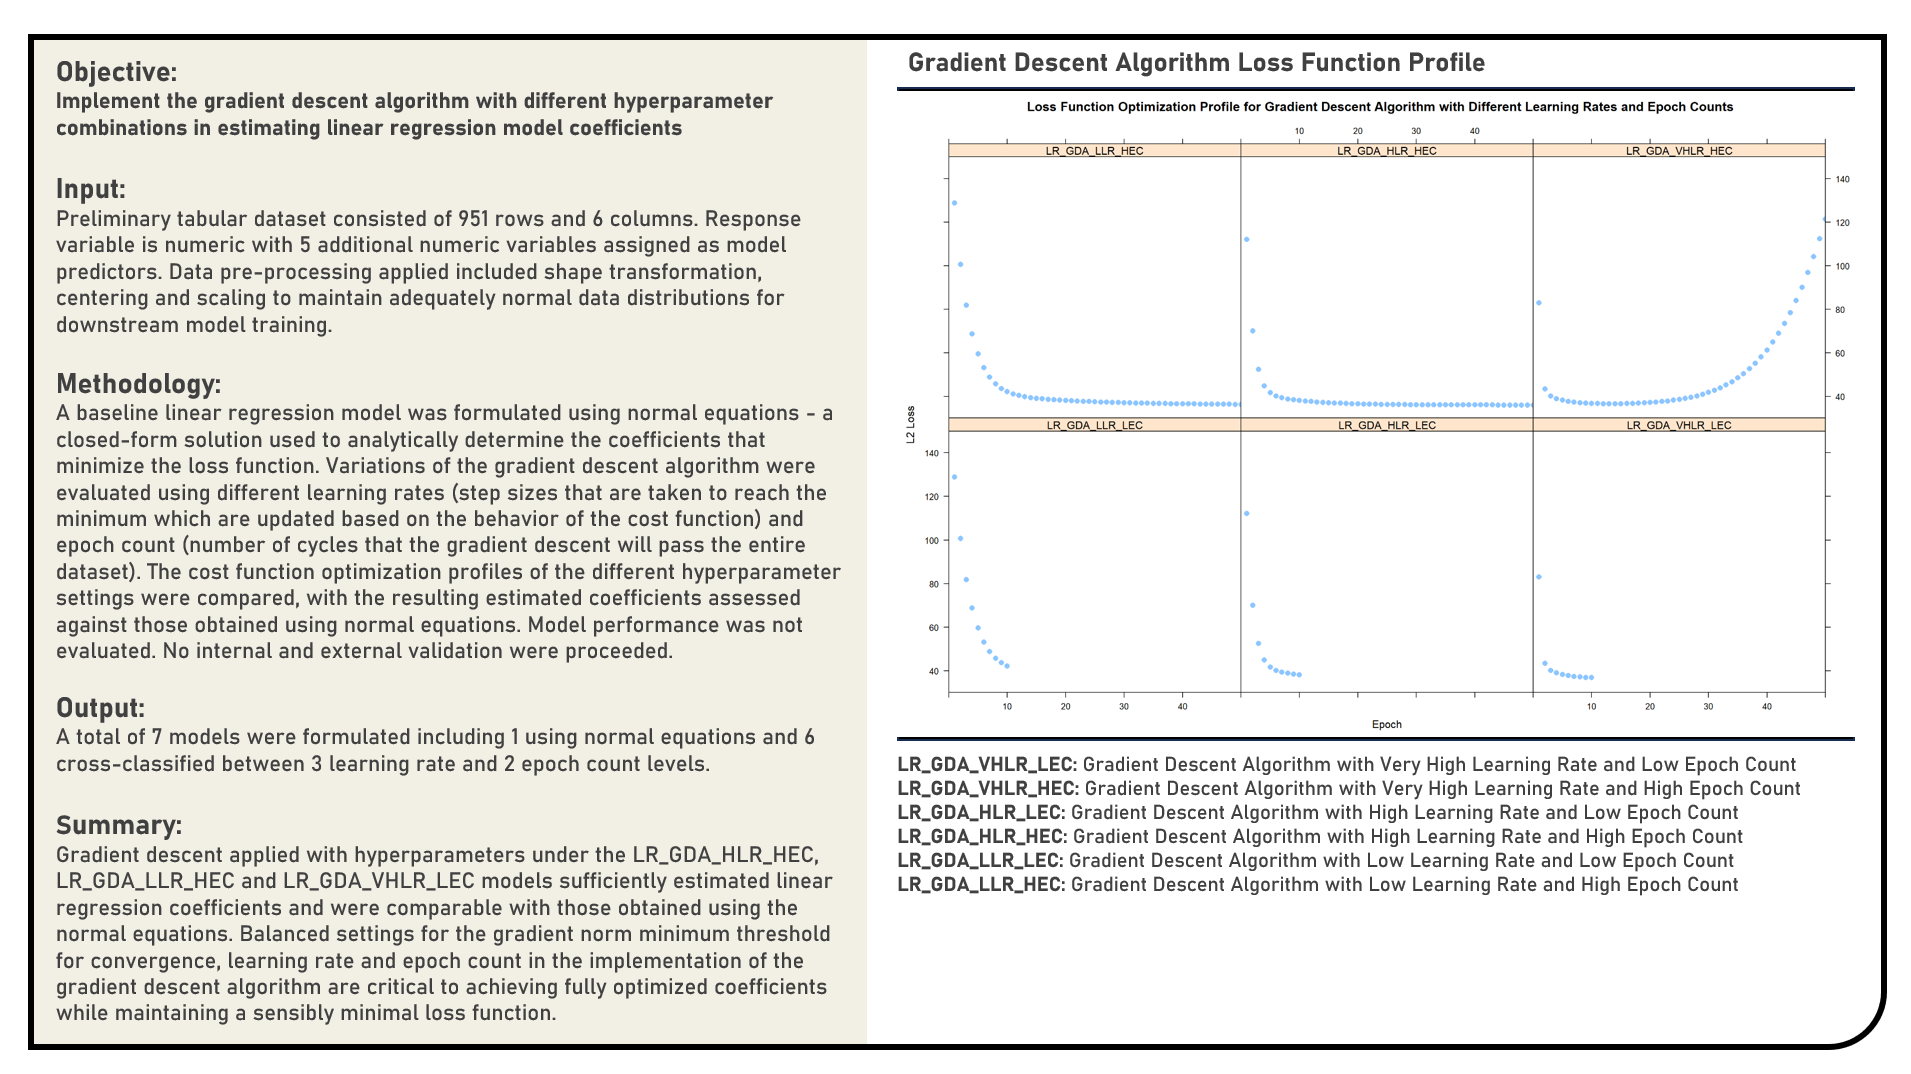
Supervised Learning : Implementing Gradient Descent Algorithm in Estimating Regression Coefficients
This project manually implements the Gradient Descent algorithm and evaluates a range of values for the learning rate and epoch count parameters to optimally estimate the coefficients of a linear regression model. The cost function optimization profiles of the different candidate parameter settings were compared, with the resulting estimated coefficients assessed against those obtained using normal equations which served as the reference baseline values.
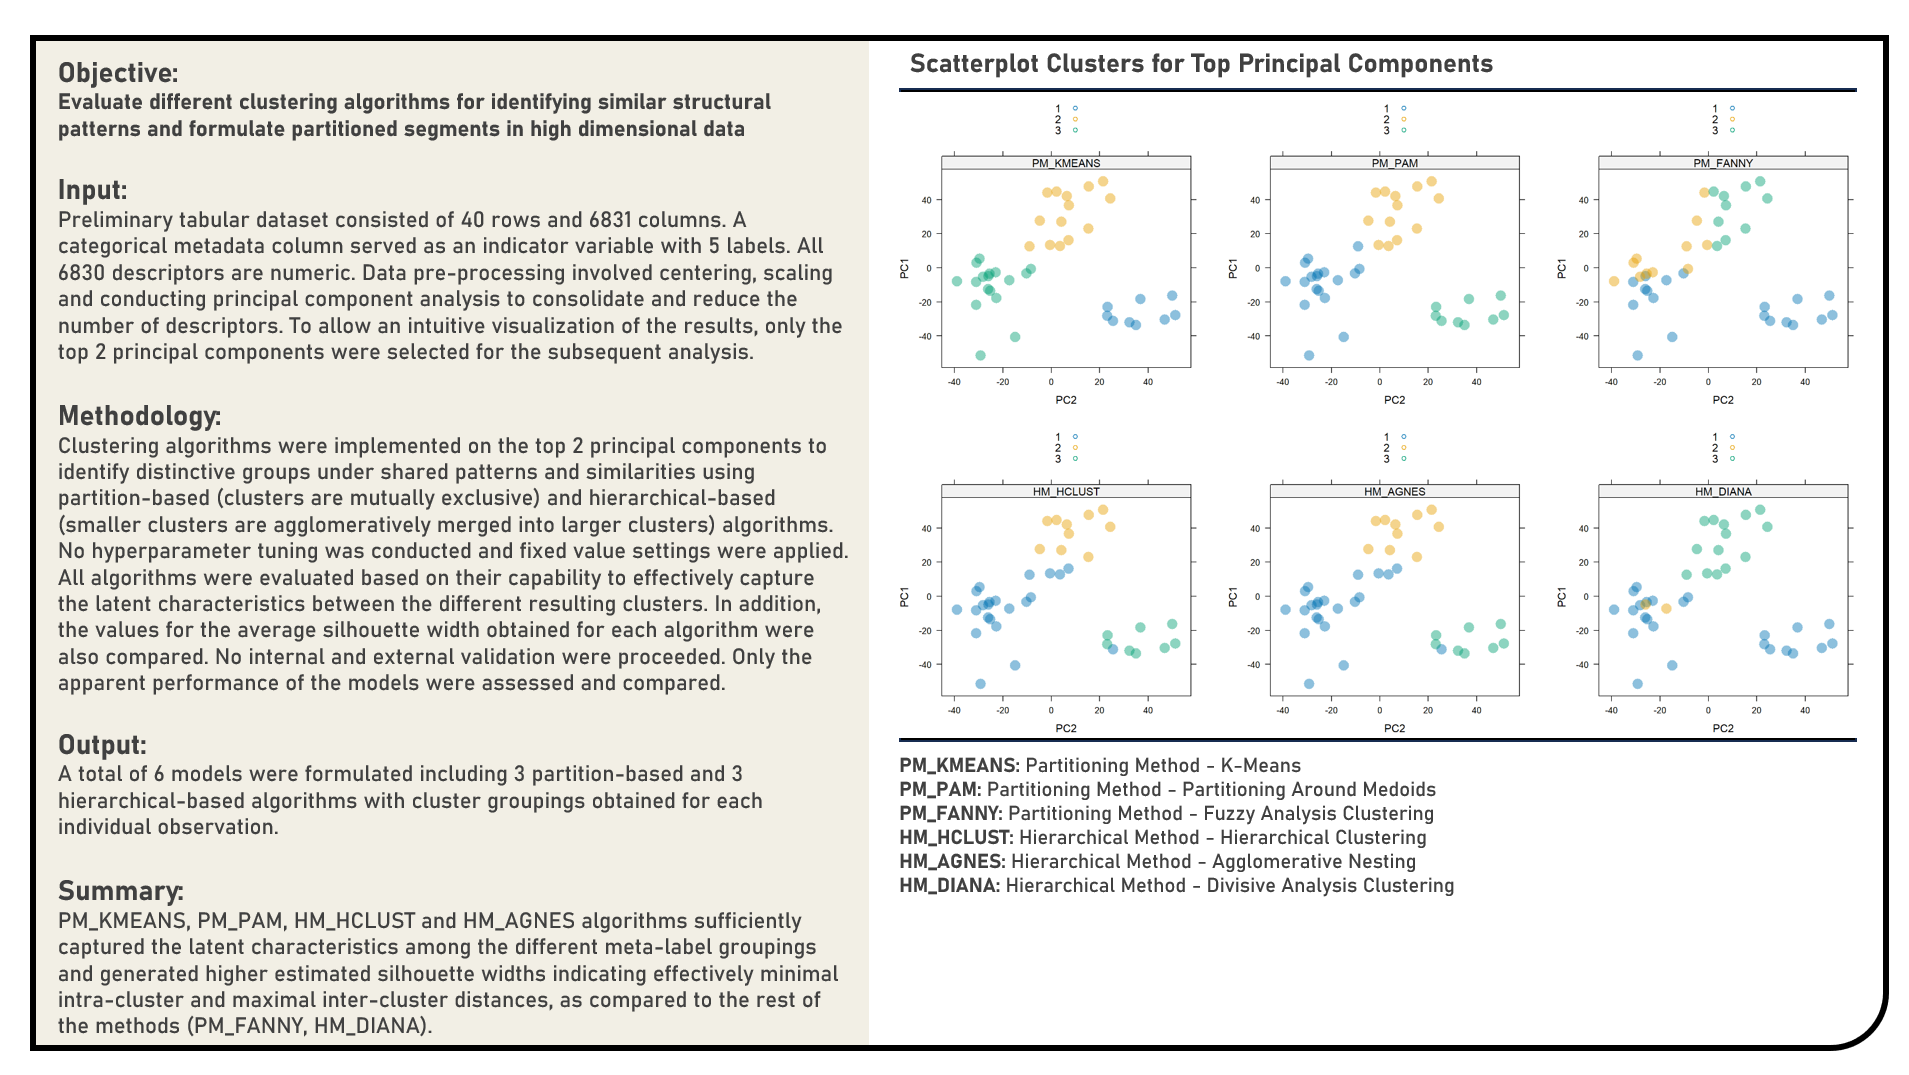
Unsupervised Learning : Formulating Segmented Groups Using Clustering Algorithms
This project explores the various clustering algorithms for segmenting information. Methods applied in the analysis to cluster high dimensional data included the K-Means, Partitioning Around Medoids, Fuzzy Analysis Clustering, Hierarchical Clustering, Agglomerative Nesting and Divisive Analysis Clustering algorithms. The different clustering algorithms were subjectively evaluated based on their capability to effectively capture the latent characteristics between the different resulting clusters. In addition, the values for the average silhouette width obtained for each algorithm were also assessed for an objective comparison of their clustering performance.
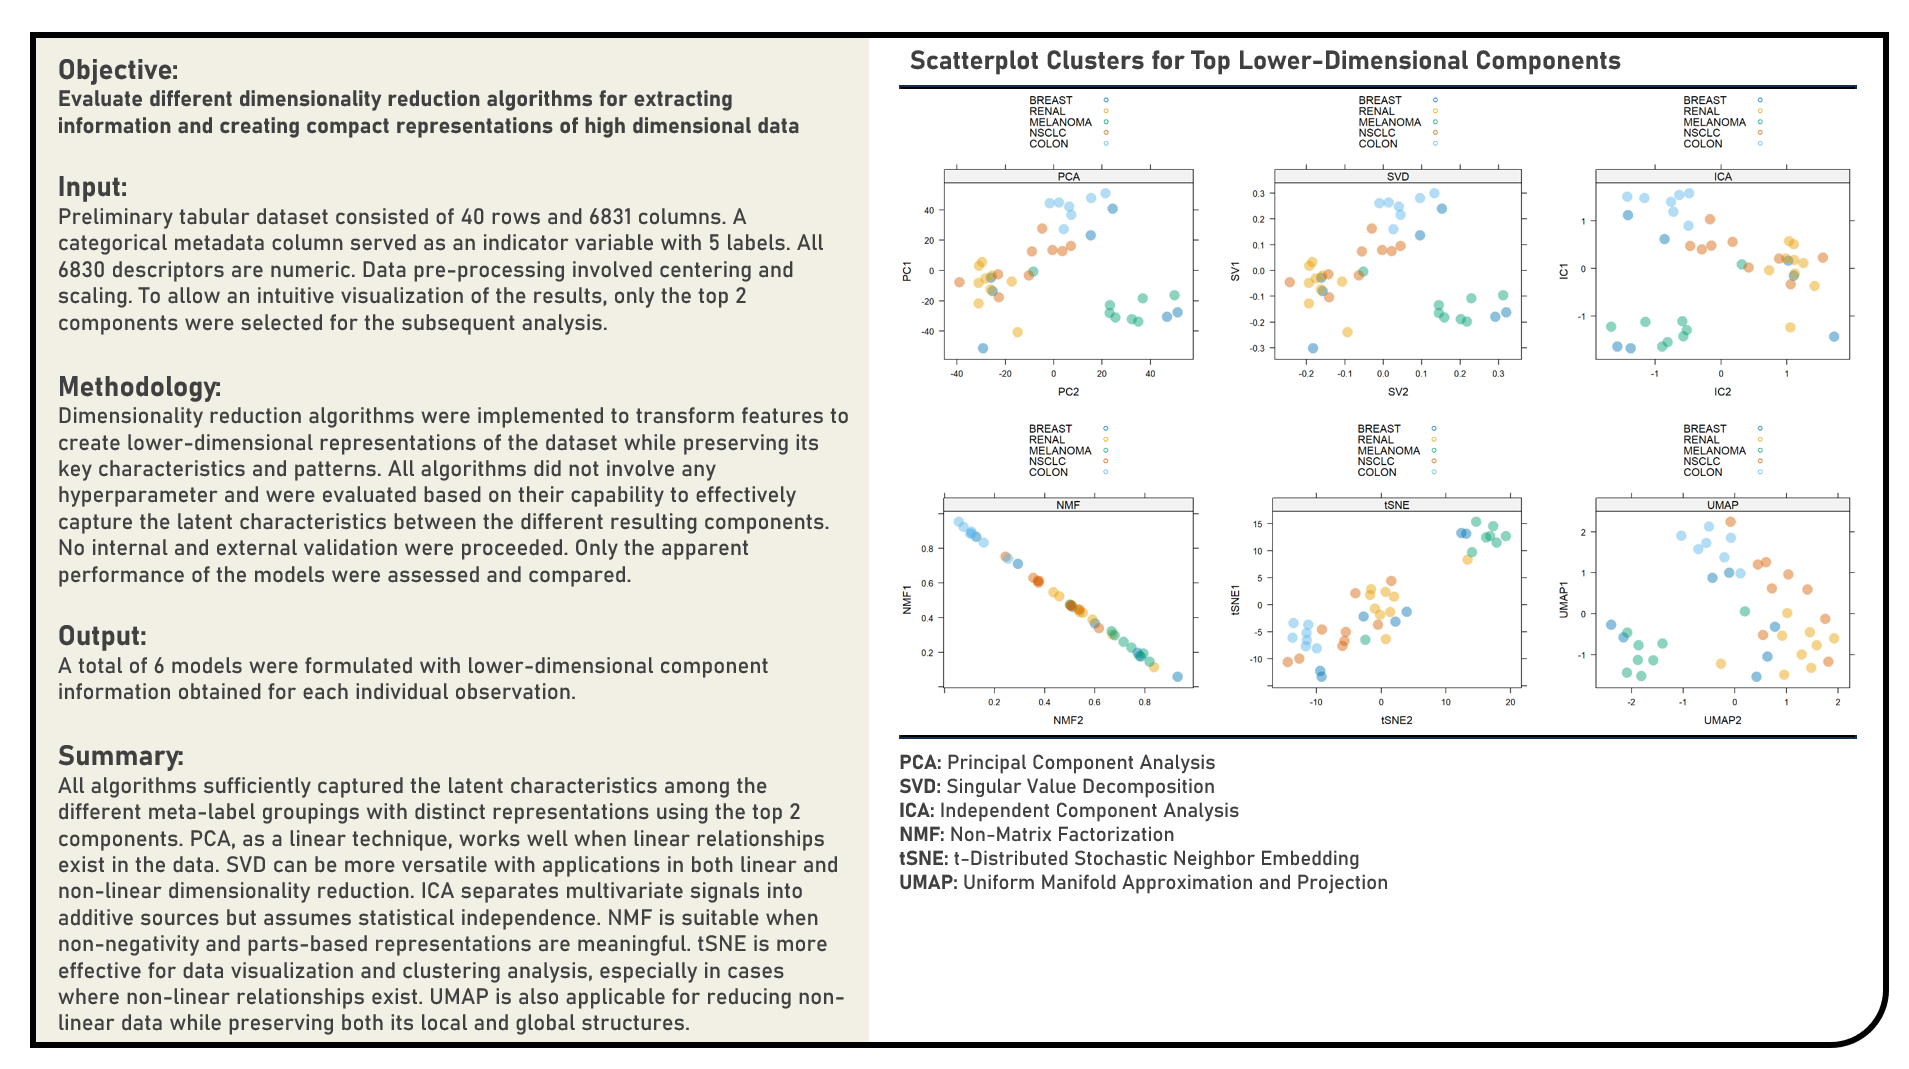
Unsupervised Learning : Extracting Information Using Dimensionality Reduction Algorithms
This project explores the various dimensionality reduction algorithms for extracting information. Methods applied in the analysis to transform and reduce high dimensional data included the Principal Component Analysis, Singular Value Decomposition, Independent Component Analysis, Non-Negative Matrix Factorization, t-Distributed Stochastic Neighbor Embedding and Uniform Manifold Approximation and Projection algorithms. The different dimensionality reduction algorithms were subjectively evaluated based on their capability to effectively capture the latent characteristics between the different resulting components.
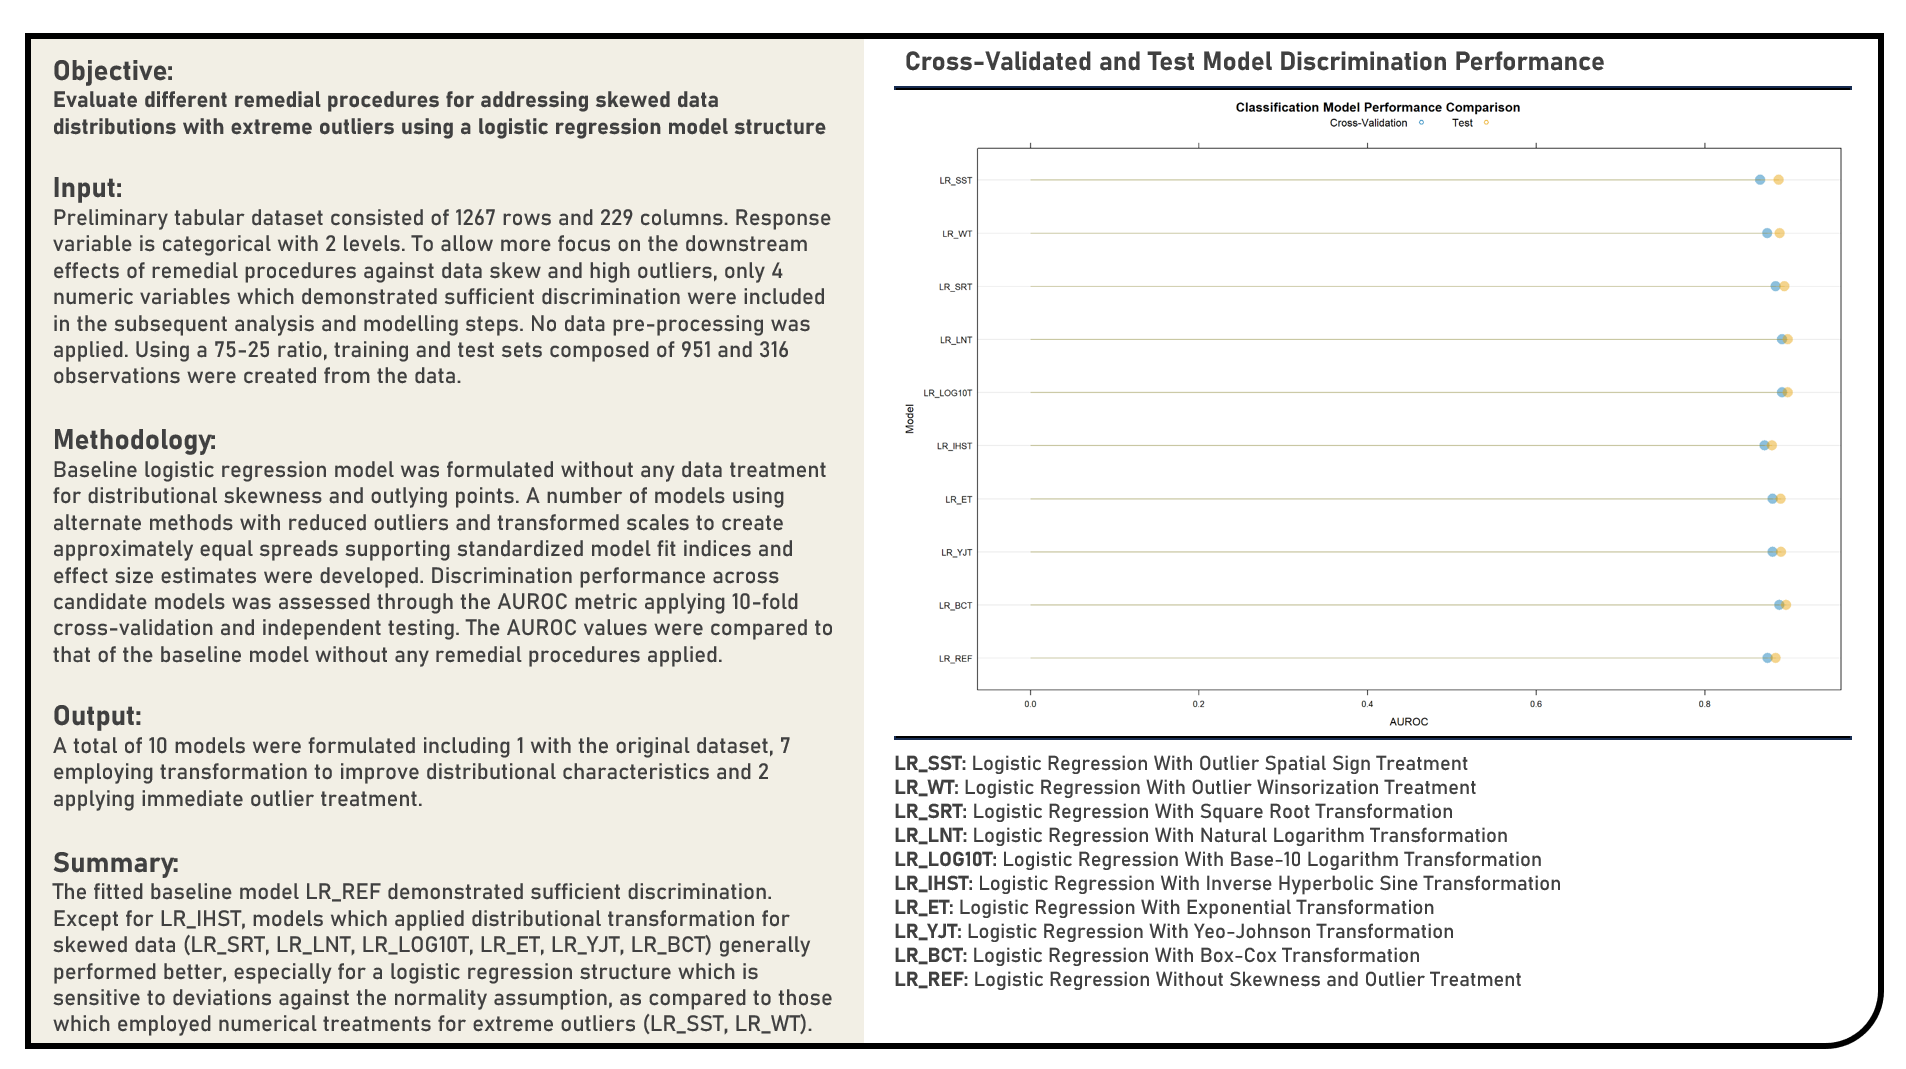
Data Preprocessing : Remedial Procedures for Skewed Data with Extreme Outliers
This project explores the various remedial procedures for handling skewed data with extreme outliers for classification. Using a Logistic Regression model structure, methods applied in the analysis to address data distribution skewness and outlying points included the Box-Cox Transformation, Yeo-Johnson Transformation, Exponential Transformation, Inverse Hyperbolic Sine Transformation, Base-10 Logarithm Transformation, Natural Logarithm Transformation, Square Root Transformation, Outlier Winsorization Treatment and Outlier Spatial Sign Treatment. The resulting predictions derived from the candidate models applying various remedial procedures were evaluated in terms of their discrimination power using the area under the receiver operating characteristics curve (AUROC) metric. The AUROC values were compared to that of the baseline model which made use of data without any form of data transformation and treatment.
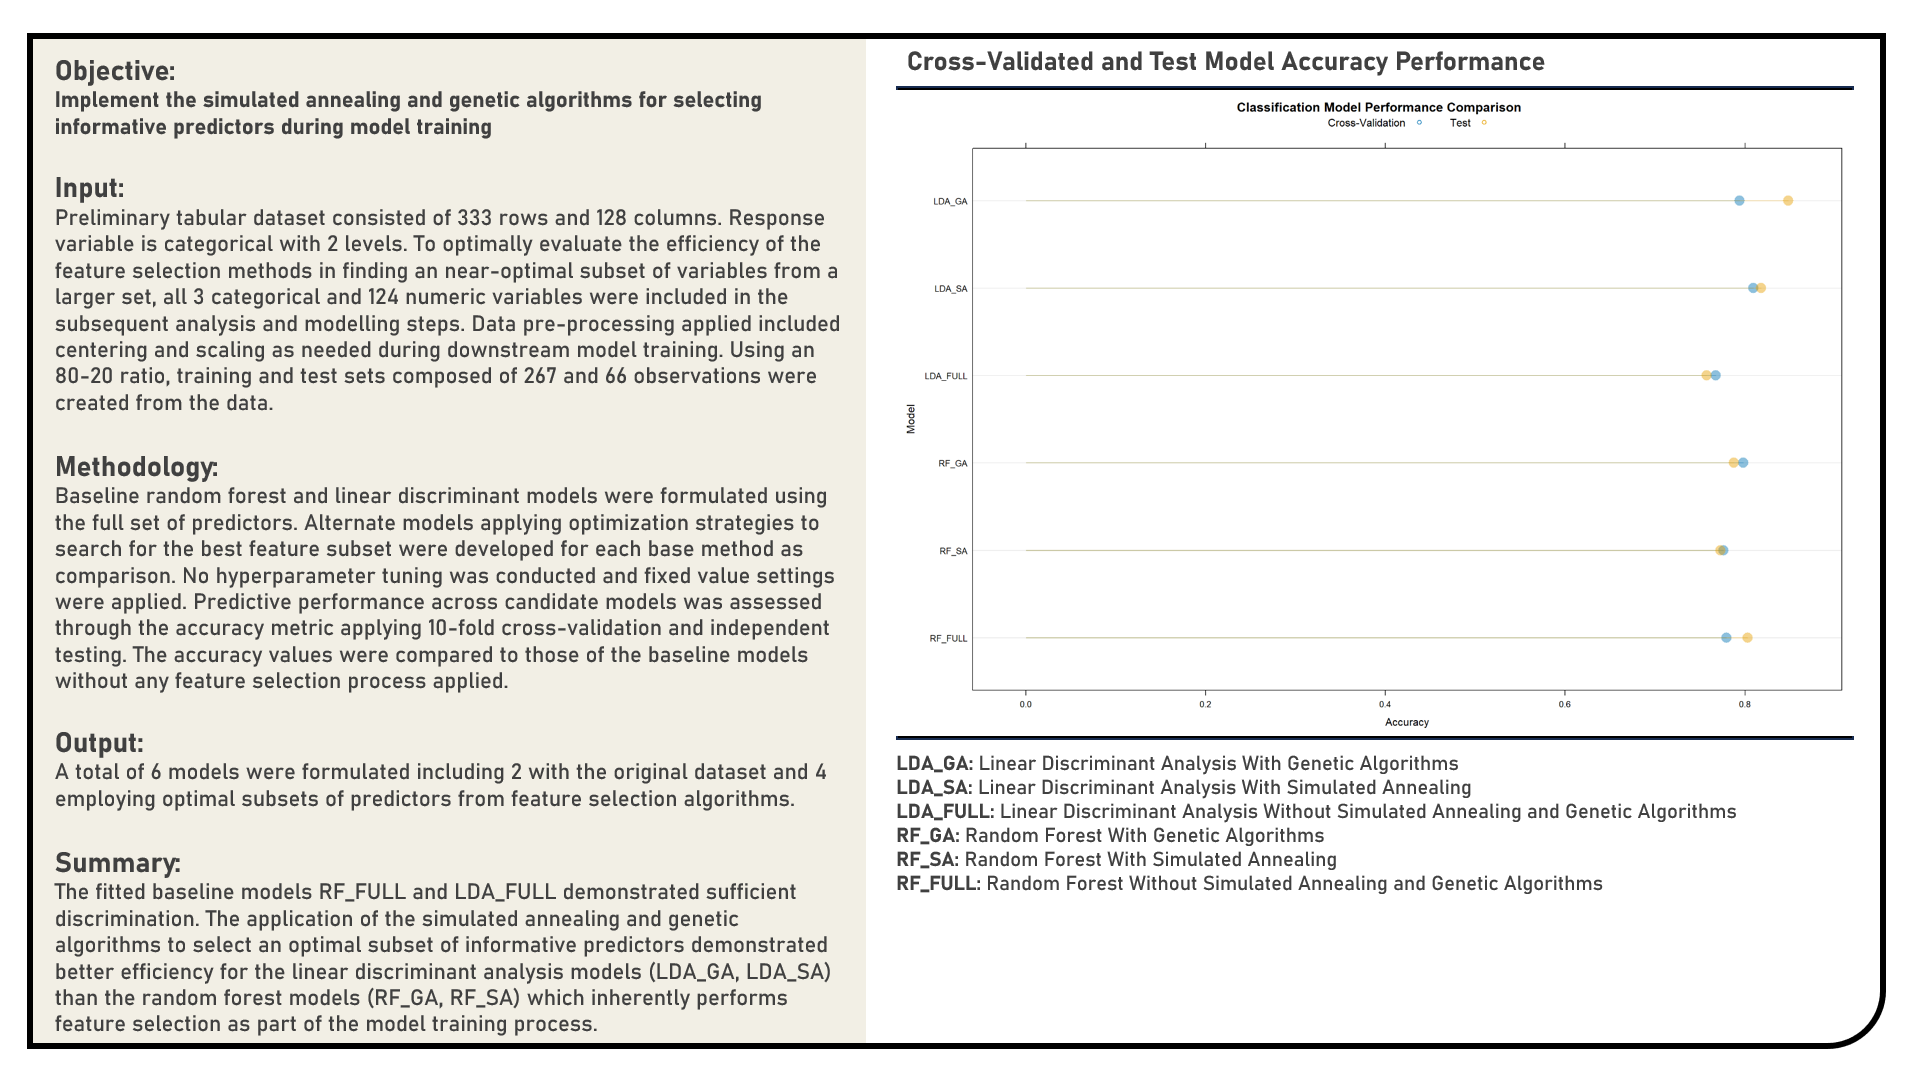
Feature Selection : Selecting Informative Predictors Using Simulated Annealing and Genetic Algorithms
This project implements Simulated Annealing and Genetic Algorithms in selecting informative predictors for a modelling problem using the Random Forest and Linear Discriminant Analysis structures. The resulting predictions derived from the candidate models applying both Simulated Annealing and Genetic Algorithms were evaluated in terms of their discrimination power using the area under the receiver operating characteristics curve (AUROC) metric. The AUROC values were compared to those of the baseline models which made use of the full data without any form of feature selection, or implemented a model-specific feature selection process.
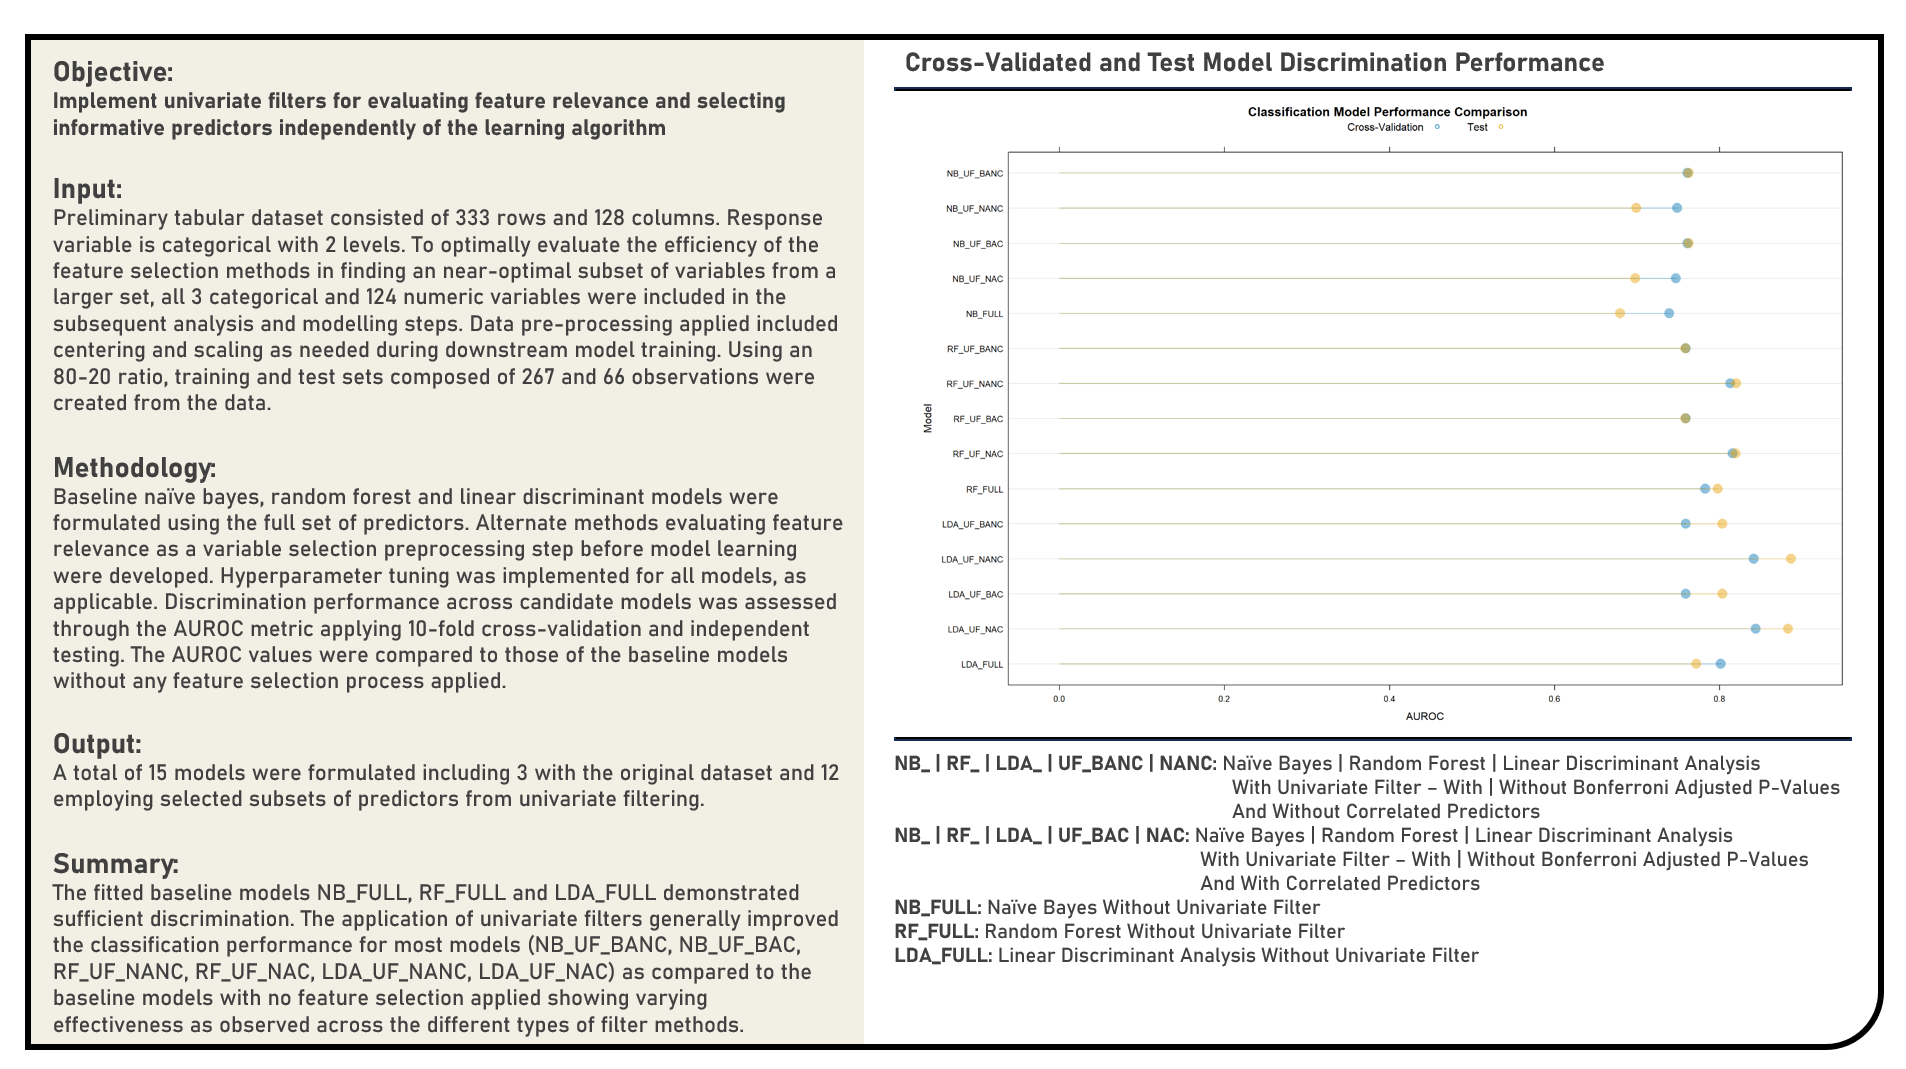
Feature Selection : Selecting Informative Predictors Using Univariate Filters
This project implements Univariate Filters in selecting informative predictors for a modelling problem. Using the Linear Discriminant Analysis, Random Forest and Naive Bayes model structures, feature selection methods applied in the analysis included the P-Value Threshold with Bonferroni Correction and Correlation Cutoff. The resulting predictions derived from the candidate models applying various Univariate Filters were evaluated in terms of their discrimination power using the area under the receiver operating characteristics curve (AUROC) metric. The AUROC values were compared to those of the baseline models which made use of the full data without any form of feature selection, or implemented a model-specific feature selection process.
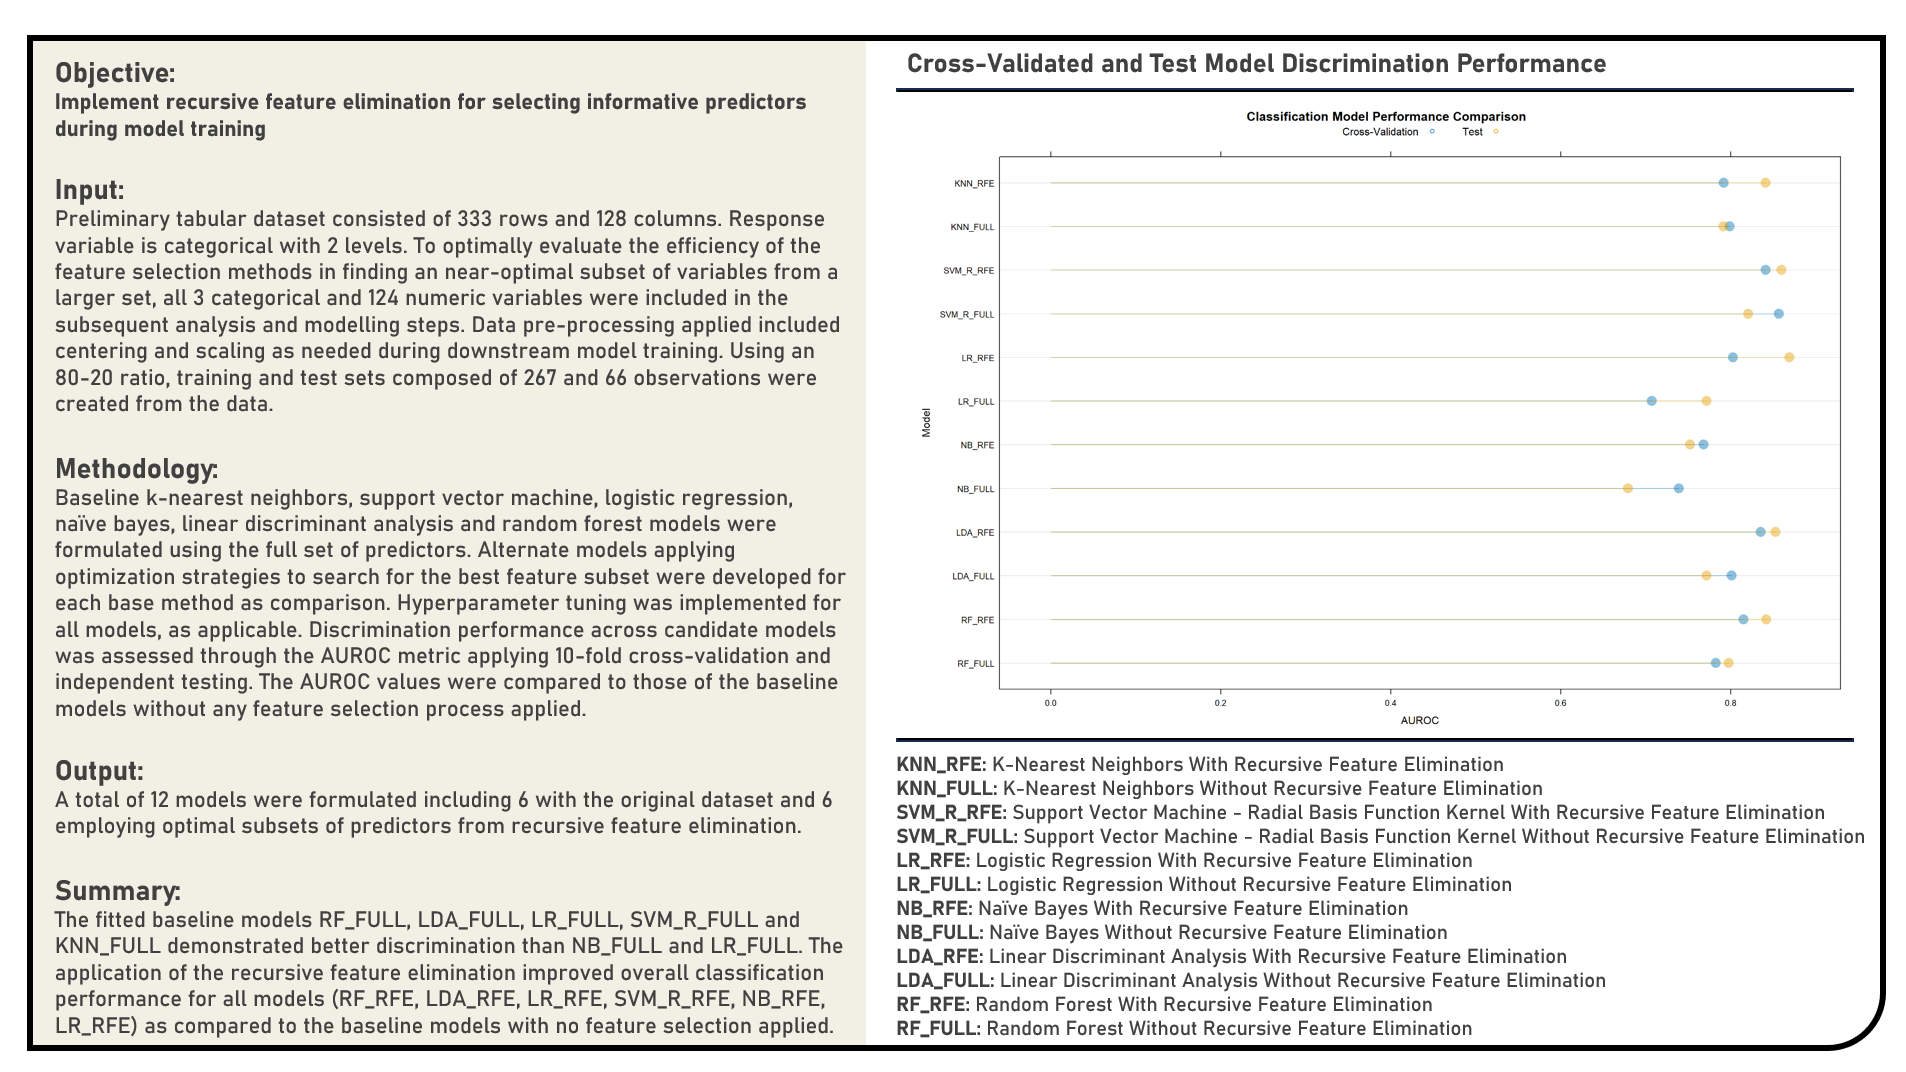
Feature Selection : Selecting Informative Predictors Using Recursive Feature Elimination
This project implements Recursive Feature Elimination in selecting informative predictors for a modelling problem using the Random Forest, Linear Discriminant Analysis, Naive Bayes, Logistic Regression, Support Vector Machine and K-Nearest Neighbors model structures. The resulting predictions derived from the candidate models applying Recursive Feature Elimination were evaluated in terms of their discrimination power using the area under the receiver operating characteristics curve (AUROC) metric. The AUROC values were compared to those of the baseline models which made use of the full data without any form of feature selection, or implemented a model-specific feature selection process.
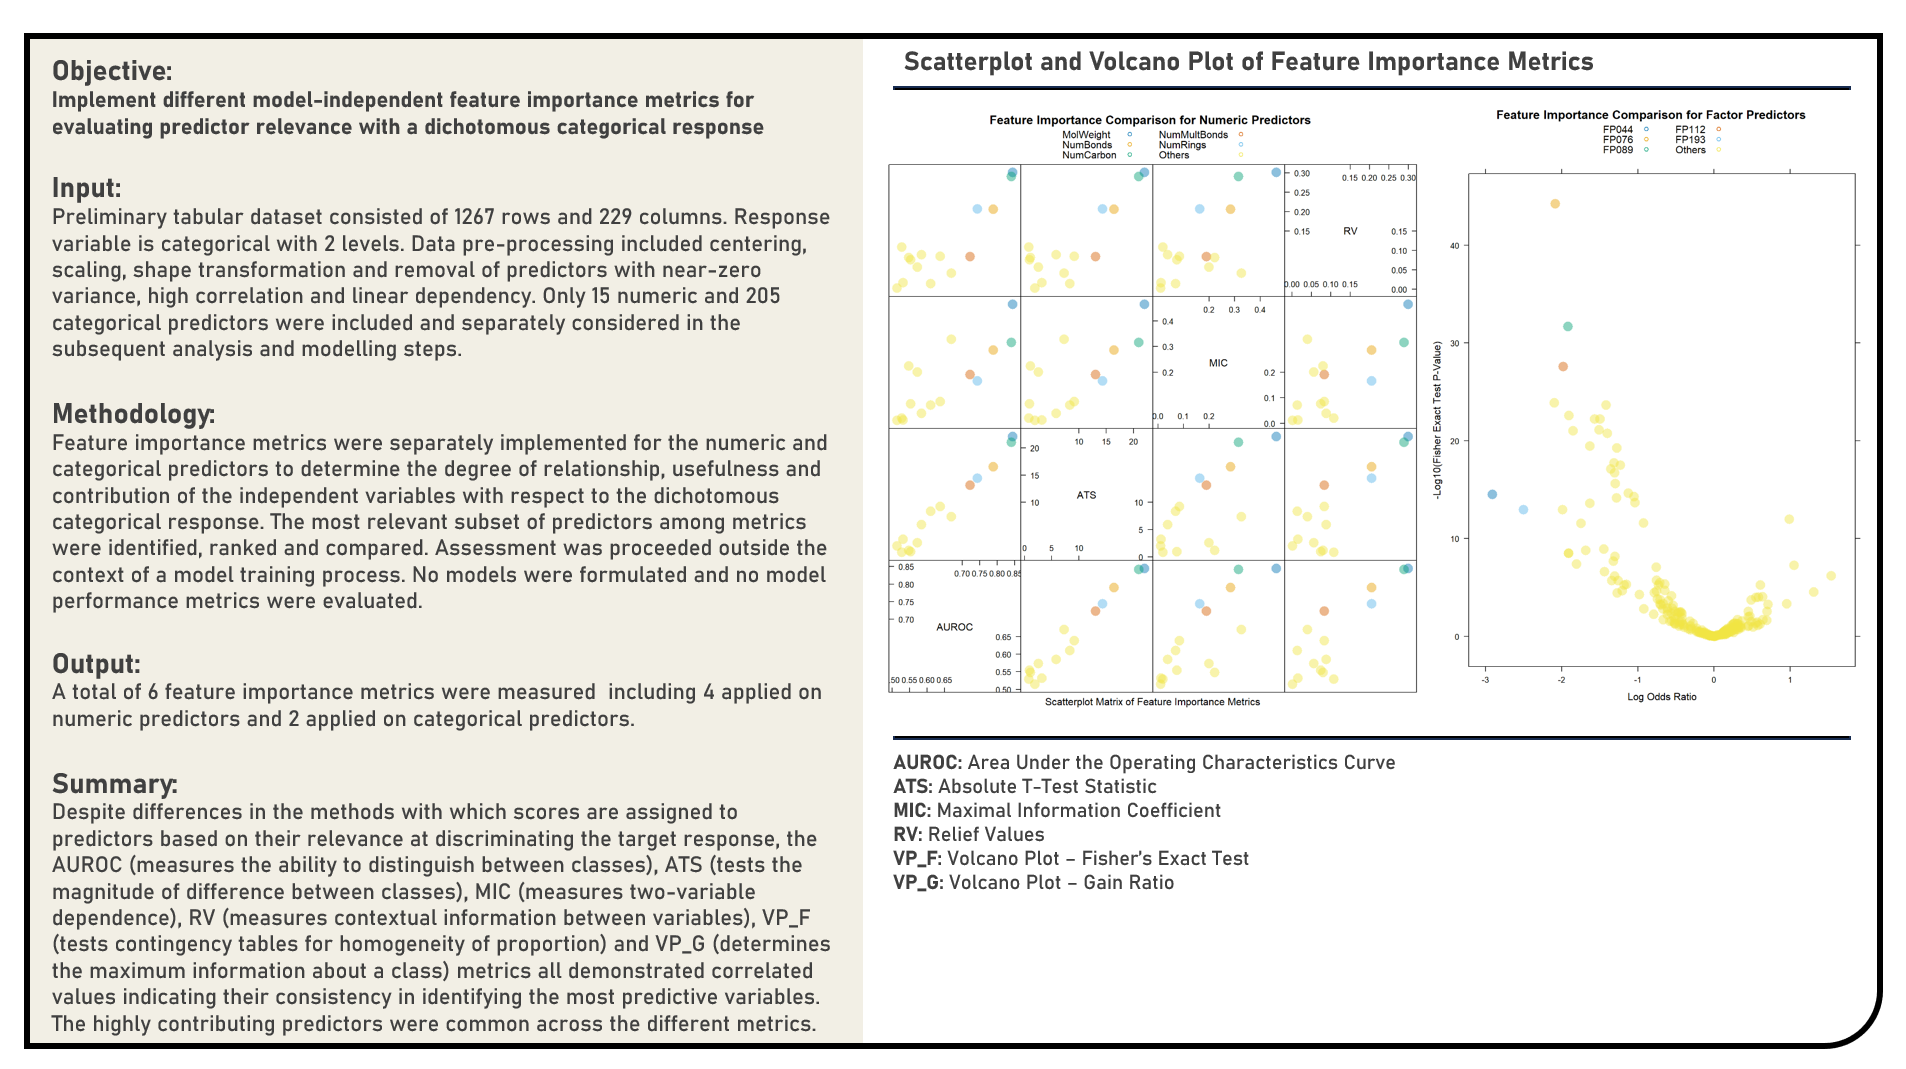
Feature Selection : Evaluating Model-Independent Feature Importance for Predictors with Dichotomous Categorical Responses
This project explores various model-independent feature importance metrics for predictors with dichotomous categorical responses. Metrics applied in the analysis to evaluate feature importance for numeric predictors included the Area Under the Receiver operating characteristics Curve (AUROC), Absolute T-Test Statistic, Maximal Information Coefficient and Relief Values, while those for factor predictors included the Volcano Plot Using Fisher’s Exact Test and Volcano Plot Using Gain Ratio.
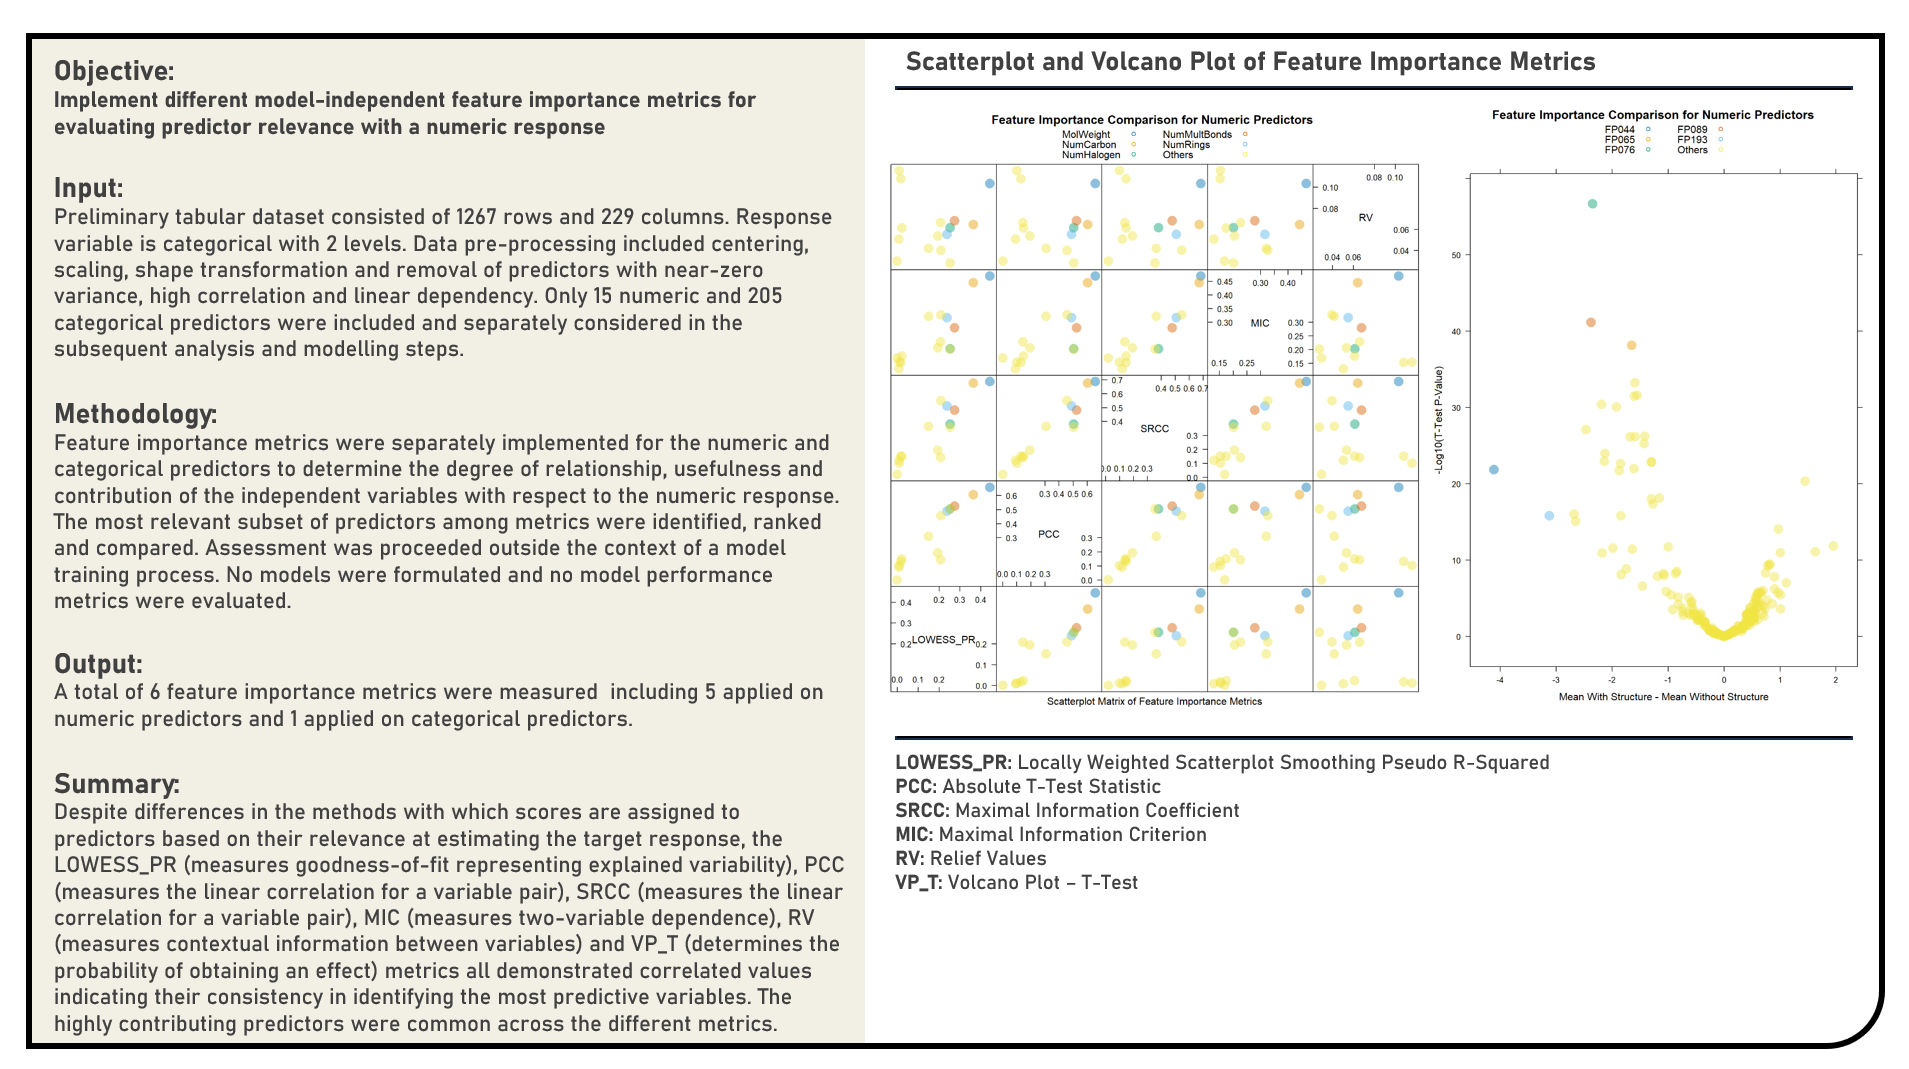
Feature Selection : Evaluating Model-Independent Feature Importance for Predictors with Numeric Responses
This project explores various model-independent feature importance metrics for predictors with numeric responses. Metrics applied in the analysis to evaluate feature importance for numeric predictors included the Locally Weighted Scatterplot Smoothing Pseudo-R-Squared, Pearson’s Correlation Coefficient, Spearman’s Rank Correlation Coefficient, Maximal Information Coefficient and Relief Values, while that for factor predictors included the Volcano Plot Using T-Test.
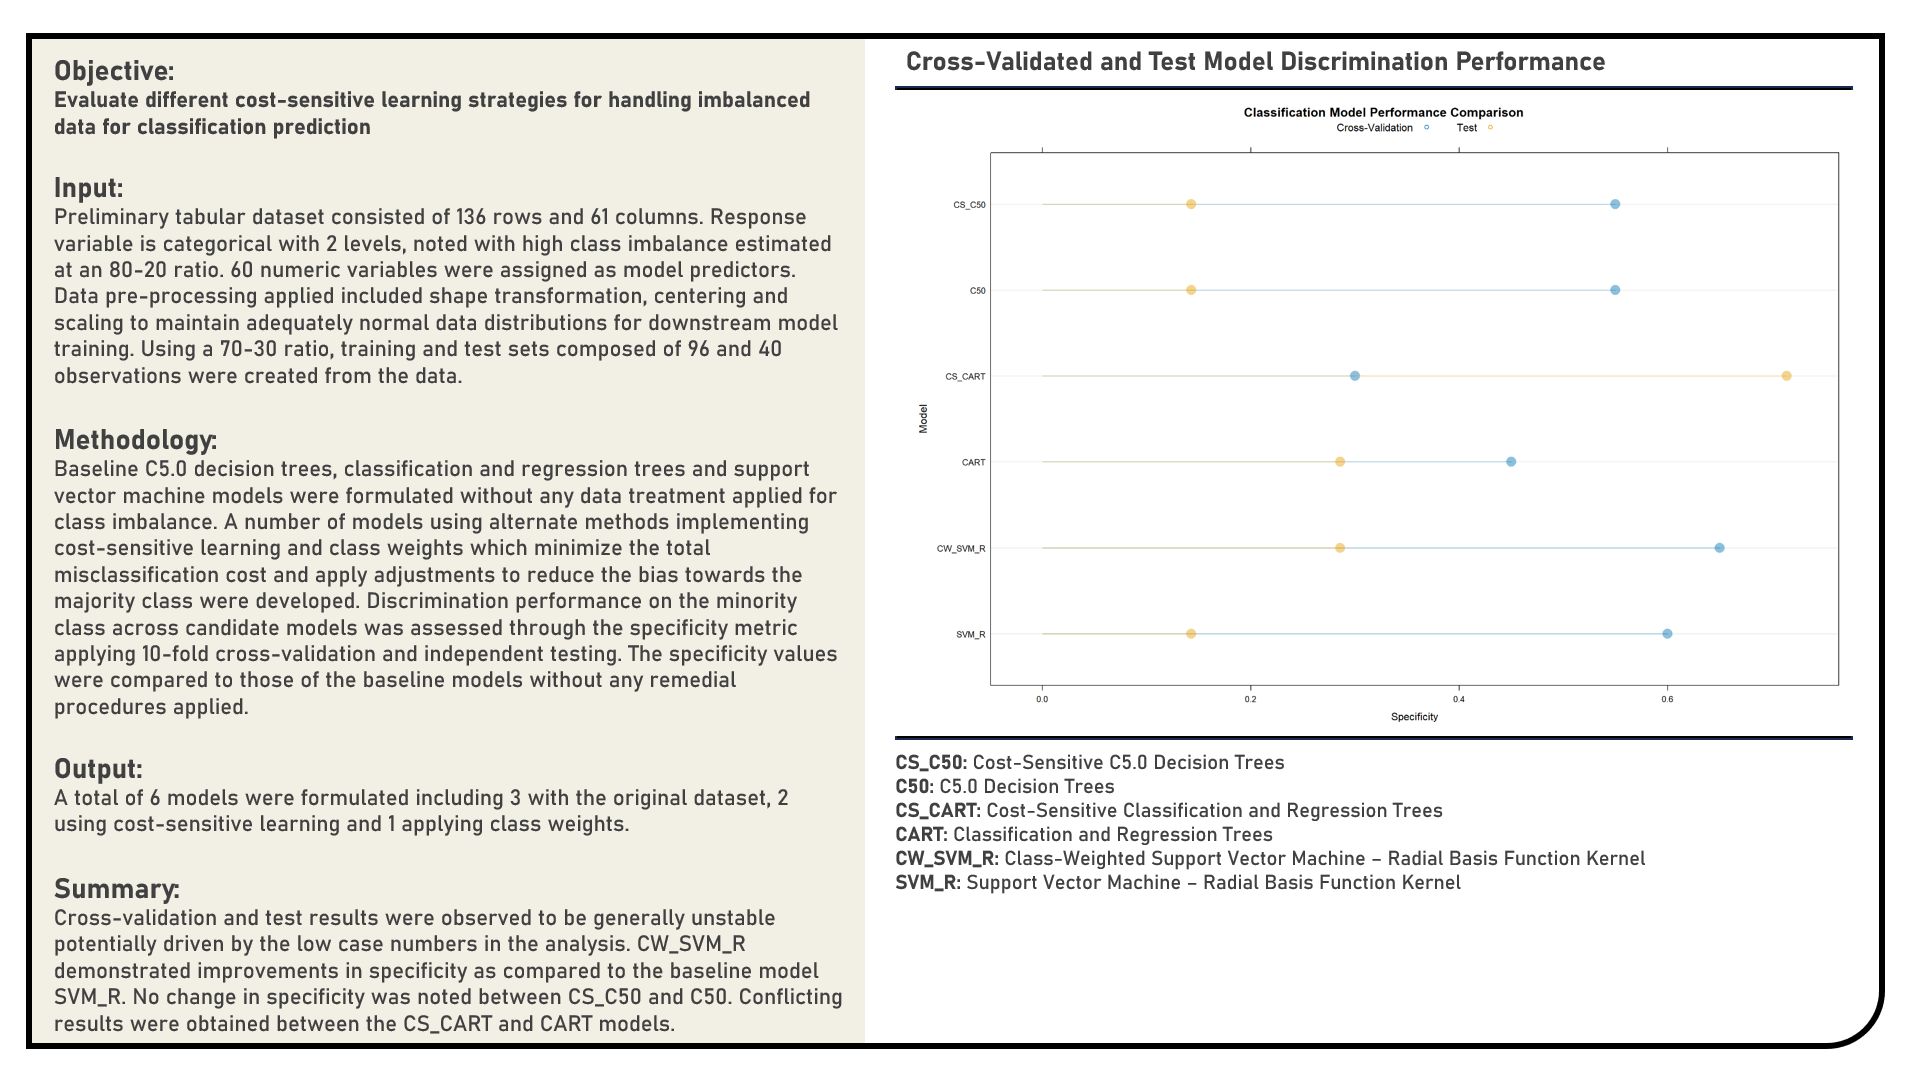
Supervised Learning : Cost-Sensitive Learning for Severe Class Imbalance
This project explores the various cost-sensitive procedures for handling imbalanced data for classification. Methods applied in the analysis to address imbalanced data included model structures which support cost-sensitive learning, namely Class-Weighted Support Vector Machine, Cost-Sensitive Classification and Regression Trees and Cost-Sensitive C5.0 Decision Trees. The resulting predictions derived from the candidate models were evaluated in terms of their discrimination power on the minority class using the specificity metric. The specificity values were compared to those of the baseline models without cost-sensitive learning applied.
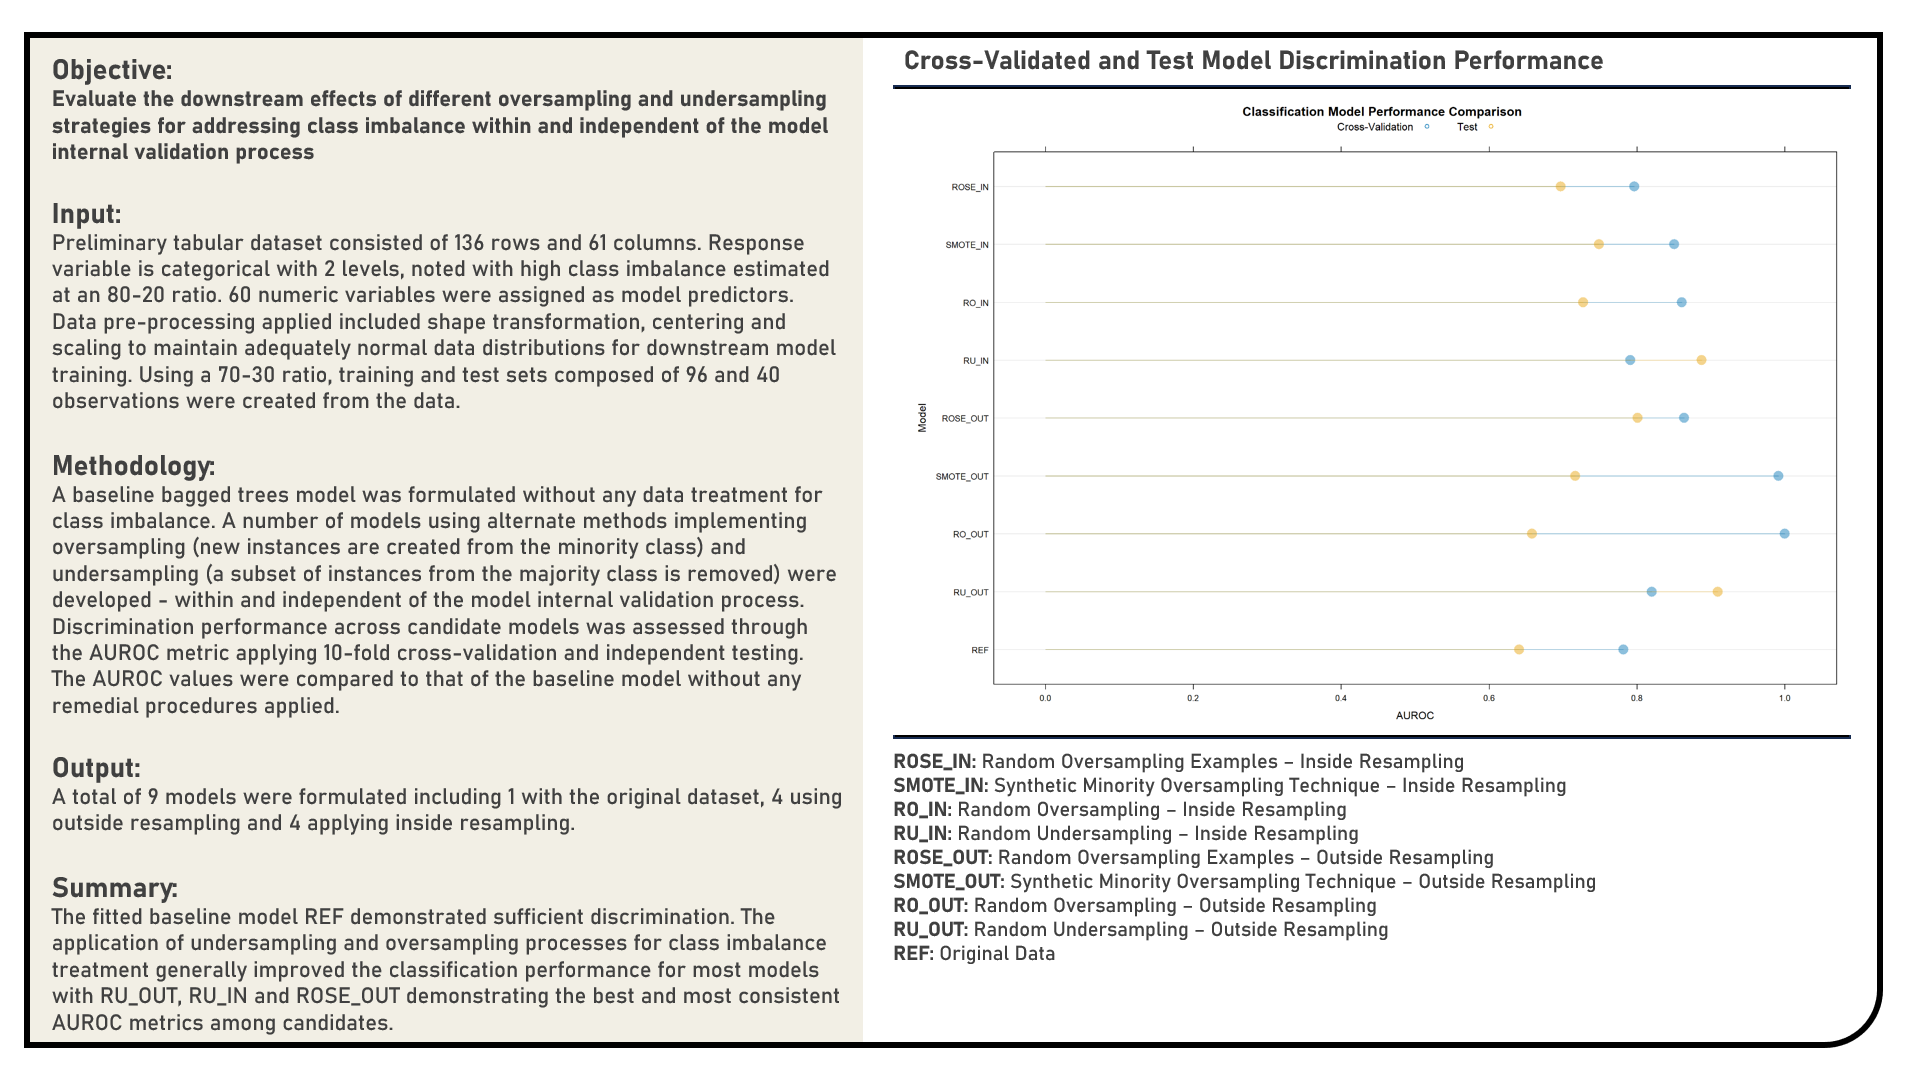
Data Preprocessing : Remedial Procedures in Handling Imbalanced Data for Classification
This project explores the various remedial procedures for handling imbalanced data for classification. Using a Bagged Trees model structure, methods applied in the analysis to address imbalanced data included the Random Undersampling, Random Oversampling, Synthetic Minority Oversampling Technique (SMOTE) and Random Oversampling Examples (ROSE). All procedures were implemented both within and independent to the model internal validation process. The resulting predictions derived from the candidate models applying various remedial procedures were evaluated in terms of their discrimination power using the area under the receiver operating characteristics curve (AUROC) metric. The AUROC values were compared to that of the baseline model without any form of data imbalance treatment.
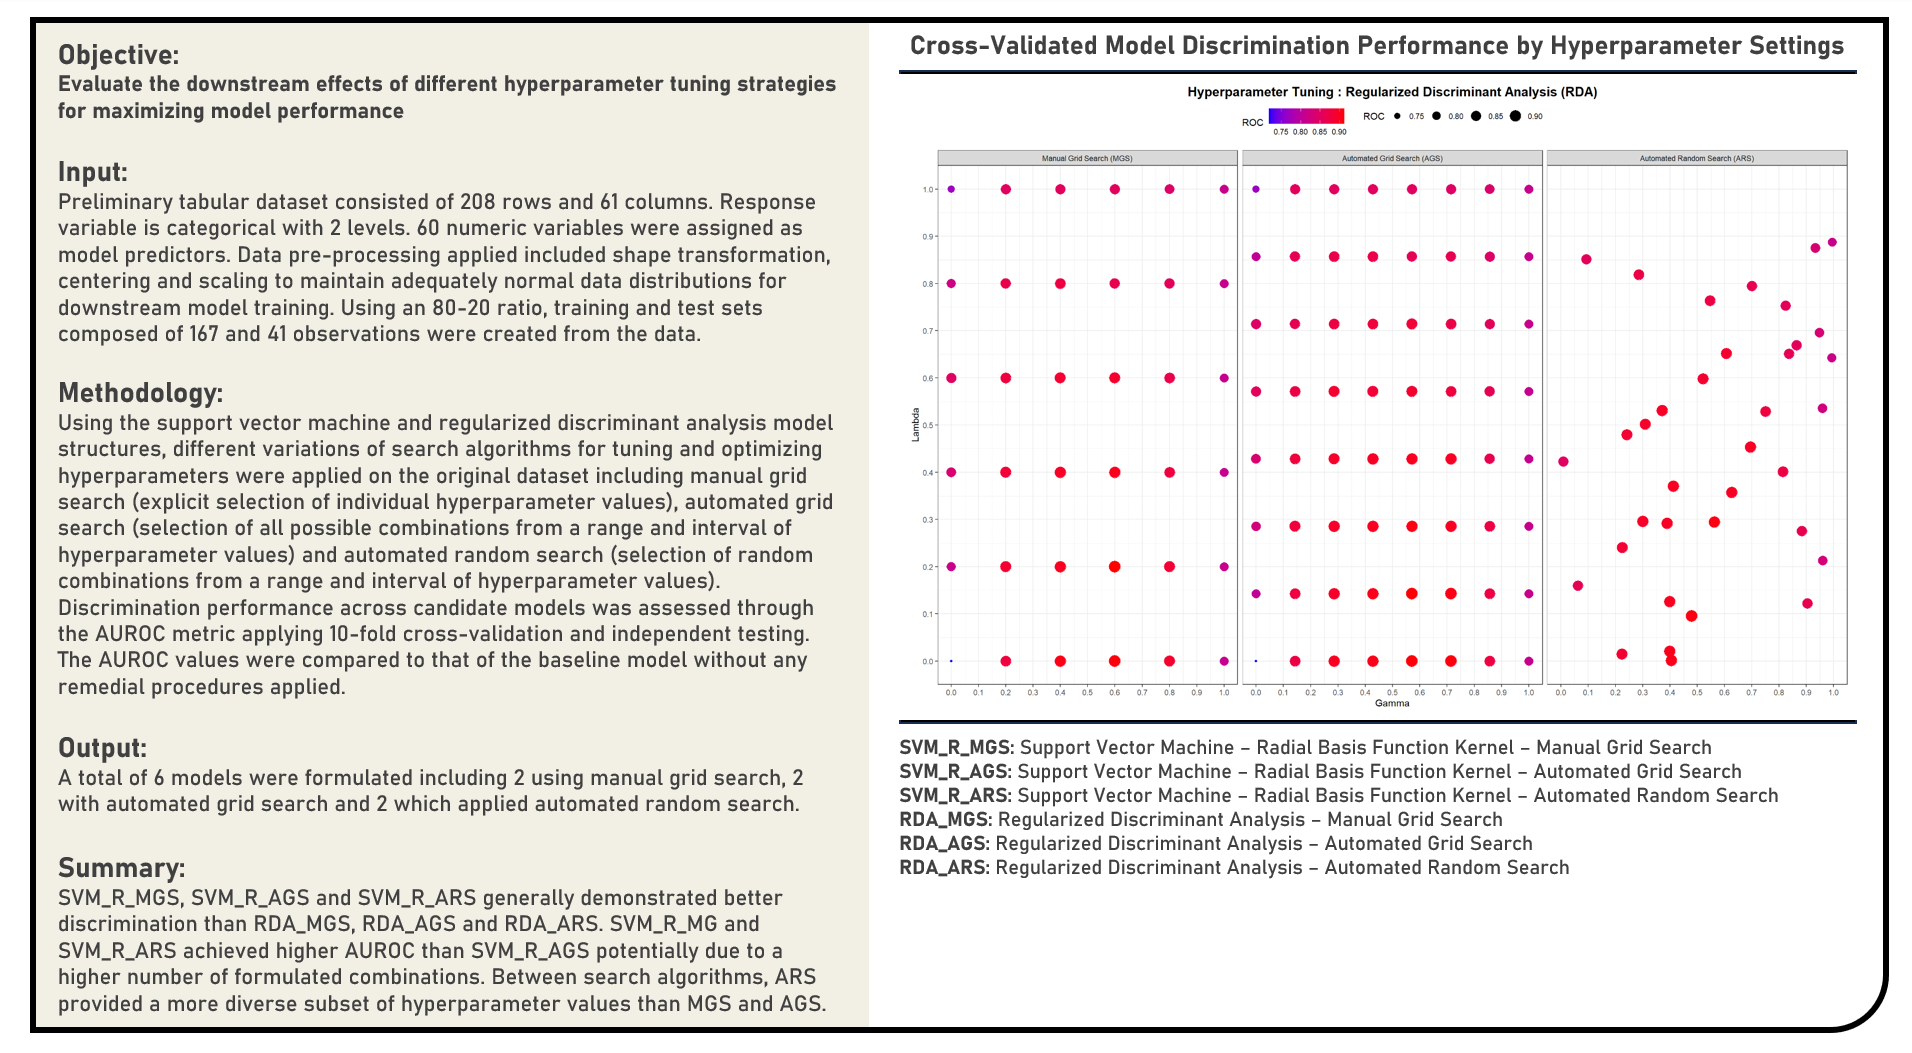
Supervised Learning : Evaluating Hyperparameter Tuning Strategies and Resampling Distributions
This project implements various evaluation procedures for hyperparameter tuning strategies and resampling distributions. Using Support Vector Machine and Regularized Discriminant Analysis model structures, methods applied in the analysis to implement hyperparameter tuning included the Manual Grid Search, Automated Grid Search and Automated Random Search with the hyperparameter selection process illustrated for each. The resulting predictions derived from the candidate models applying various hyperparameter tuning procedures were evaluated in terms of their discrimination power using the area under the receiver operating characteristics curve (AUROC) metric.
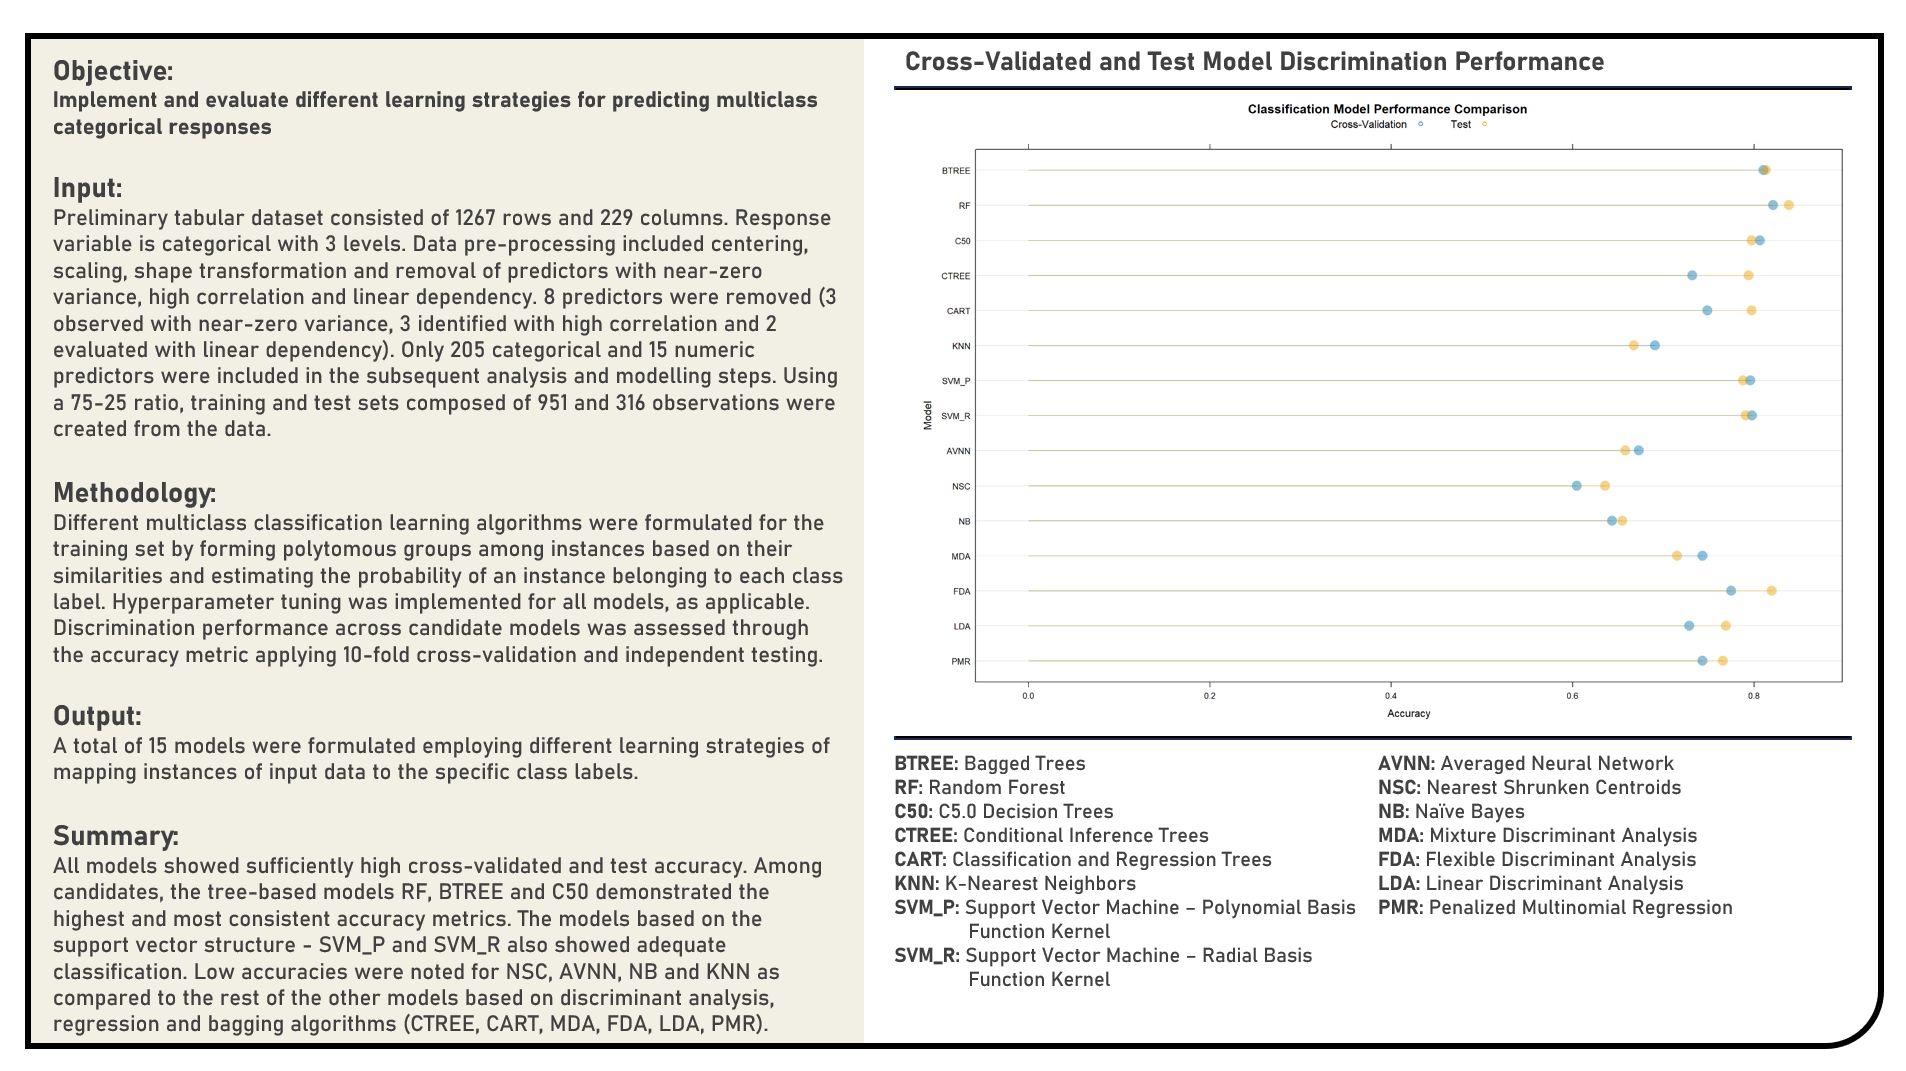
Supervised Learning : Modelling Multiclass Categorical Responses for Prediction
This project implements various predictive modelling procedures for multiclass categorical responses. Models applied in the analysis to predict multiclass categorical responses included the Penalized Multinomial Regression, Linear Discriminant Analysis, Flexible Discriminant Analysis, Mixture Discriminant Analysis, Naive Bayes, Nearest Shrunken Centroids, Averaged Neural Network, Support Vector Machine (Radial Basis Function Kernel, Polynomial Kernel), K-Nearest Neighbors, Classification and Regression Trees (CART), Conditional Inference Trees, C5.0 Decision Trees, Random Forest and Bagged Trees algorithms. The resulting predictions derived from the candidate models were evaluated in terms of their classification performance using the accuracy metric.
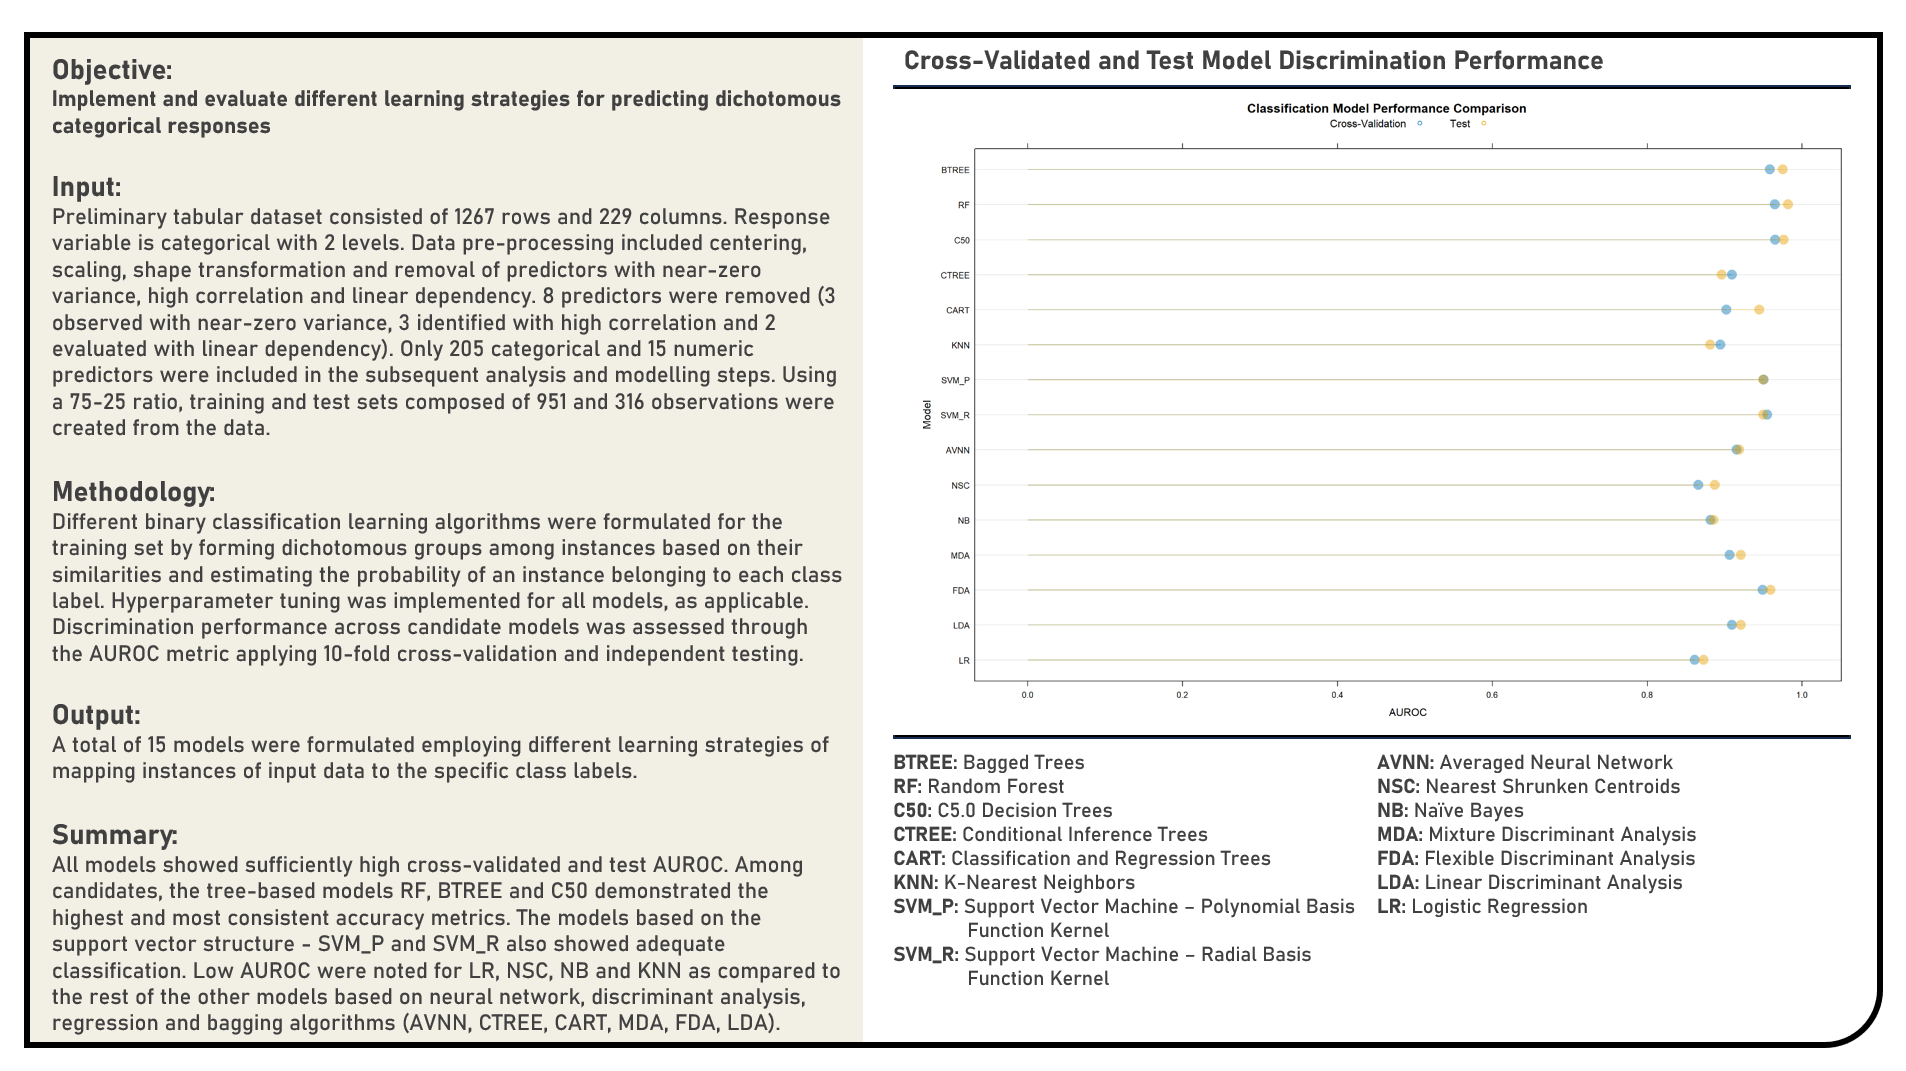
Supervised Learning : Modelling Dichotomous Categorical Responses for Prediction
This project implements various predictive modelling procedures for dichotomous categorical responses. Models applied in the analysis to predict dichotomous categorical responses included the Logistic Regression, Linear Discriminant Analysis, Flexible Discriminant Analysis, Mixture Discriminant Analysis, Naive Bayes, Nearest Shrunken Centroids, Averaged Neural Network, Support Vector Machine (Radial Basis Function Kernel, Polynomial Kernel), K-Nearest Neighbors, Classification and Regression Trees (CART), Conditional Inference Trees, C5.0 Decision Trees, Random Forest and Bagged Trees algorithms. The resulting predictions derived from the candidate models were evaluated in terms of their discrimination power using the area under the receiver operating characteristics curve (AUROC) metric.
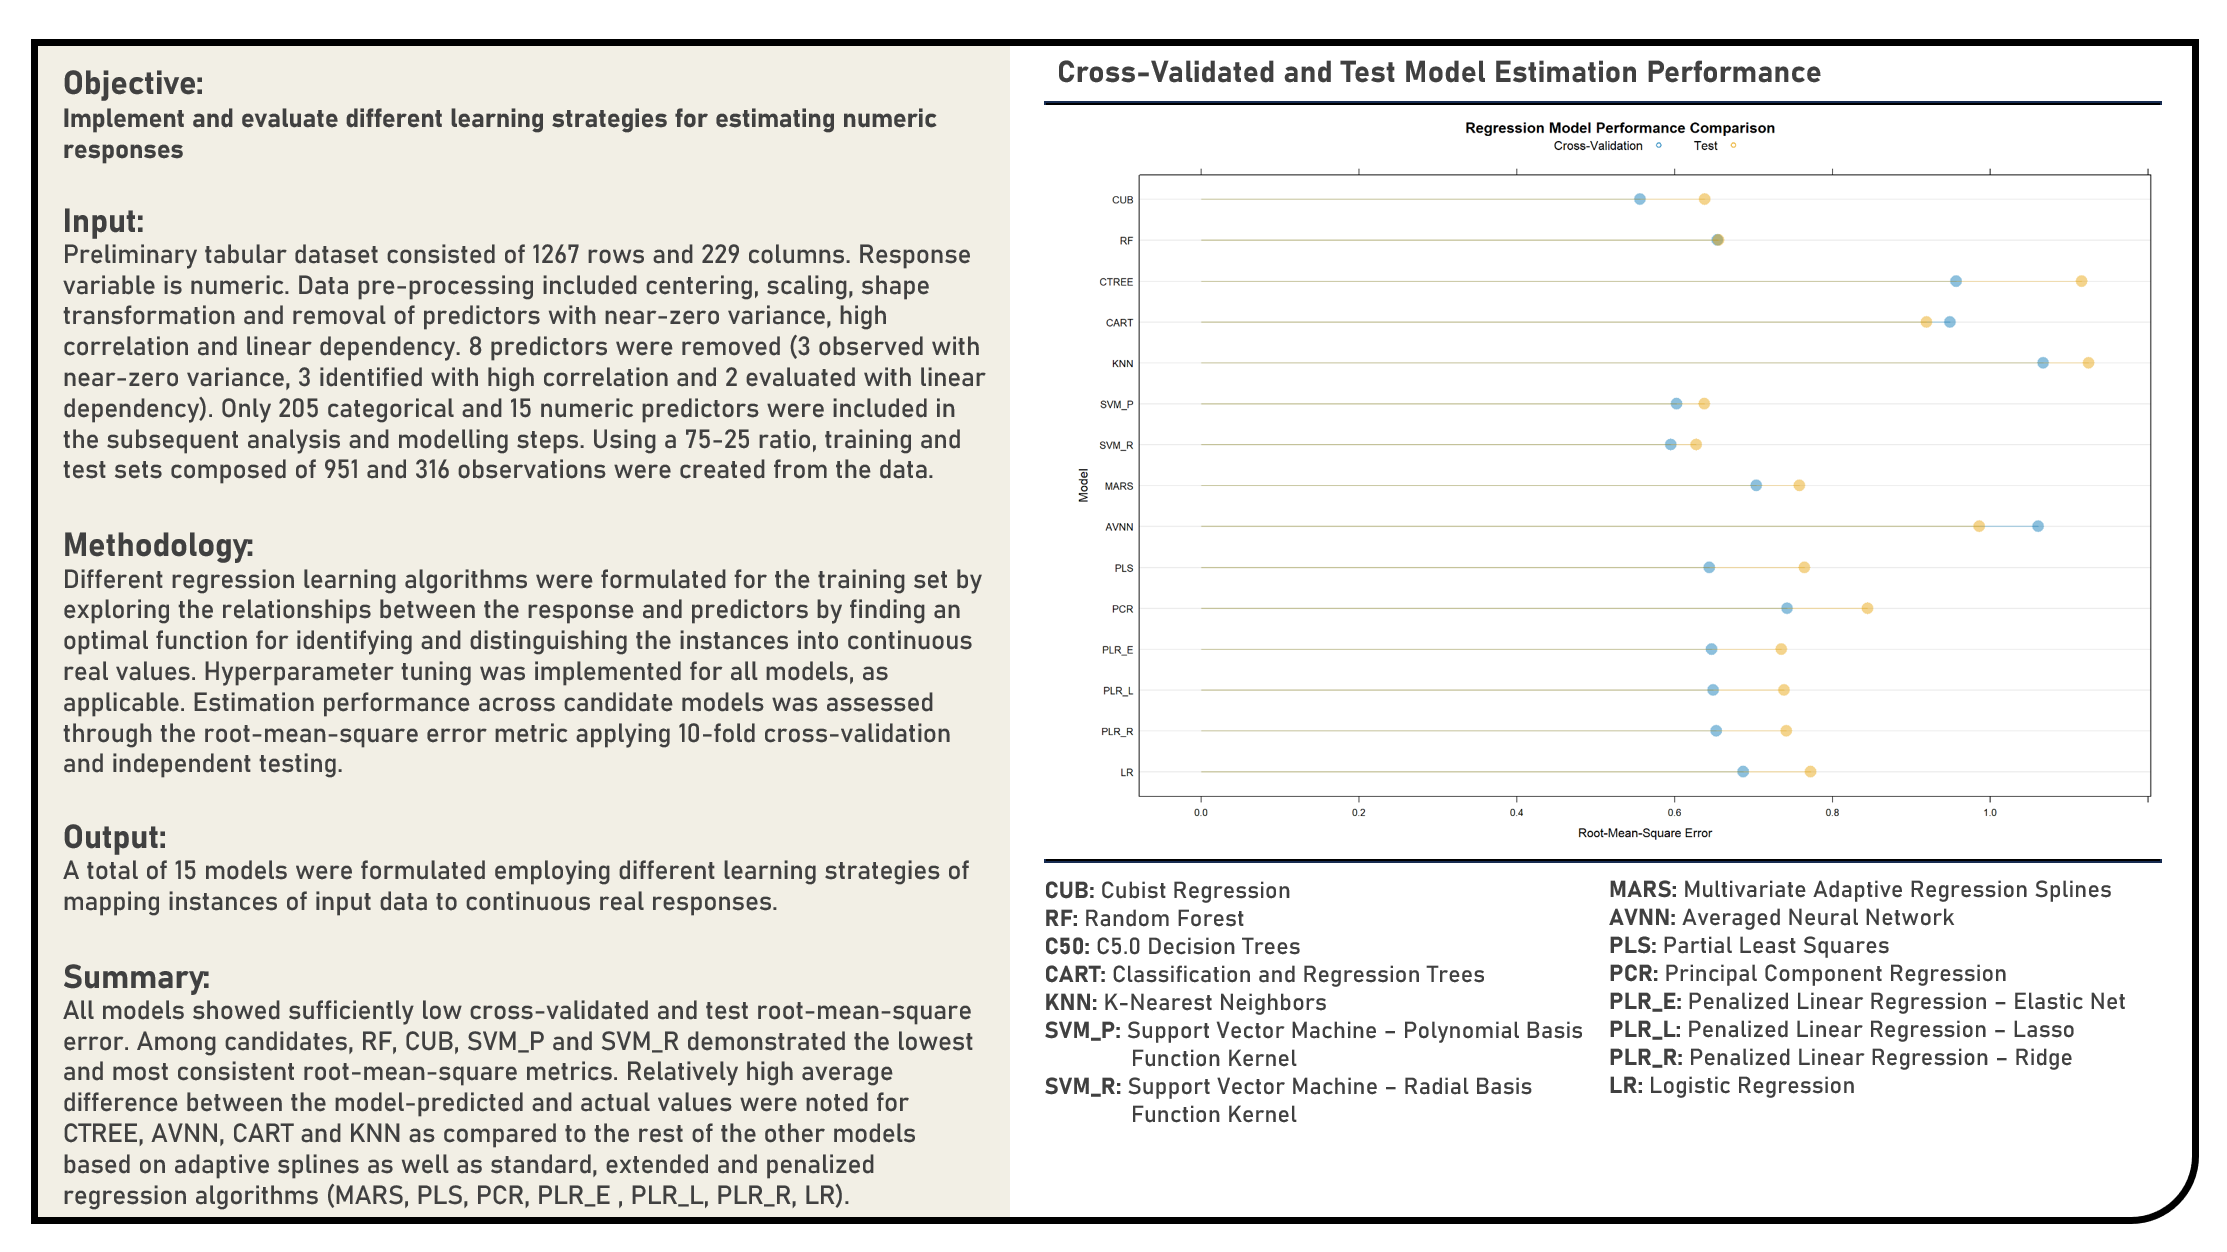
Supervised Learning : Modelling Numeric Responses for Prediction
This project implements various predictive modelling procedures for numeric responses. Models applied in the analysis to predict numeric responses included the Linear Regression, Penalized Regression (Ridge, Least Absolute Shrinkage and Selection Operator (LASSO), ElasticNet), Principal Component Regression, Partial Least Squares, Averaged Neural Network, Multivariate Adaptive Regression Splines (MARS), Support Vector Machine (Radial Basis Function Kernel, Polynomial Kernel), K-Nearest Neighbors, Classification and Regression Trees (CART), Conditional Inference Trees, Random Forest and Cubist algorithms. The resulting predictions derived from the candidate models were evaluated in terms of their model fit using the r-squared and root mean squred error (RMSE) metrics.
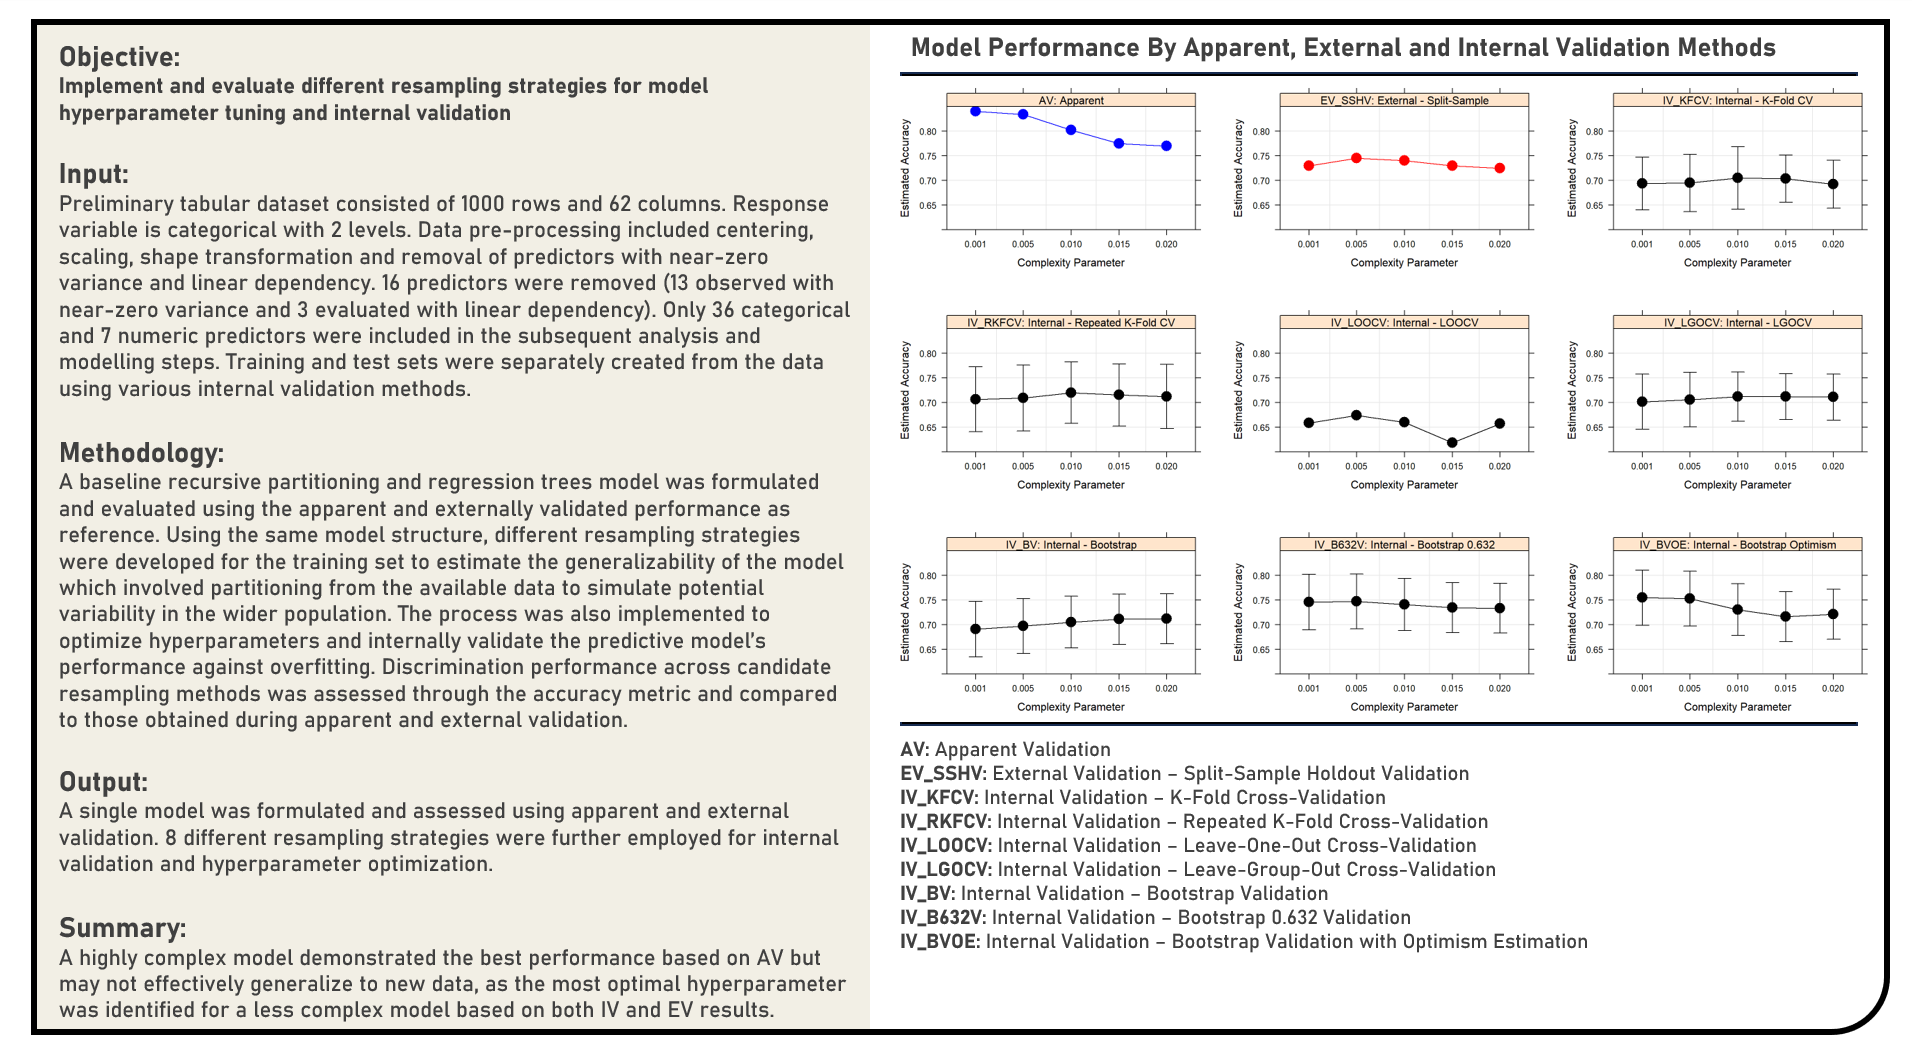
Supervised Learning : Resampling Procedures for Model Hyperparameter Tuning and Internal Validation
This project explores various resampling procedures during model hyperparameter tuning and internal validation. Using a Recursive Partitioning and Regression Trees model structure, resampling methods applied in the analysis for tuning model hyperparameters and internally validating model performance included K-Fold Cross Validation, Repeated K-Fold Cross Validation, Leave-One-Out Cross Validation, Leave-Group-Out Cross Validation, Bootstrap Validation, Bootstrap 0.632 Validation and Bootstrap with Optimism-Estimation Validation. The resulting predictions derived from the candidate models with their respective optimal hyperparameters were evaluated in terms of their classification performance using the accuracy metric, which were subsequently compared to the baseline model’s apparent performance values.
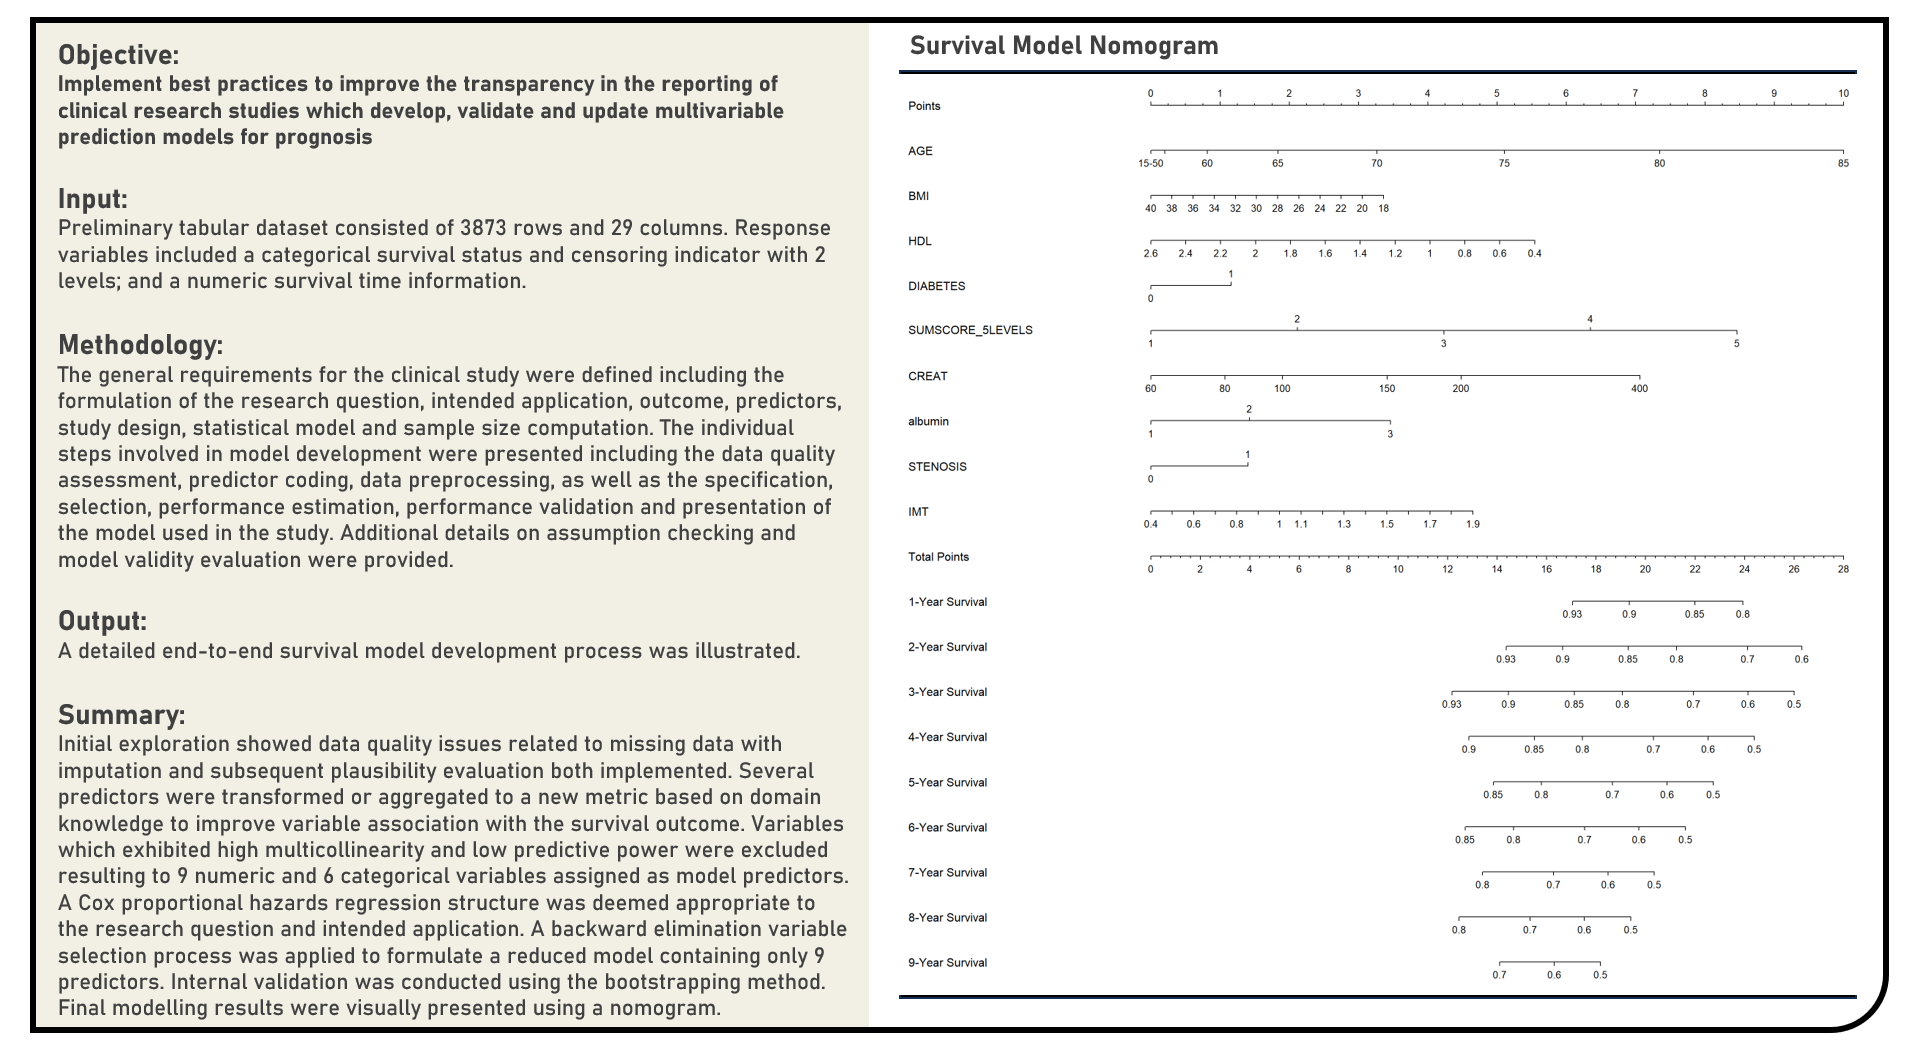
Supervised Learning : Clinical Research Prediction Model Development and Evaluation for Prognosis
This project explores the best practices when developing and evaluating prognostic models for clinical research. The general requirements for the clinical study were defined including the formulation of the research question, intended application, outcome, predictors, study design, statistical model and sample size computation. The individual steps involved in model development were presented including the data quality assessment, predictor coding, data preprocessing, as well as the specification, selection, performance estimation, performance validation and presentation of the model used in the study. Additional details on model validity evaluation was also provided.
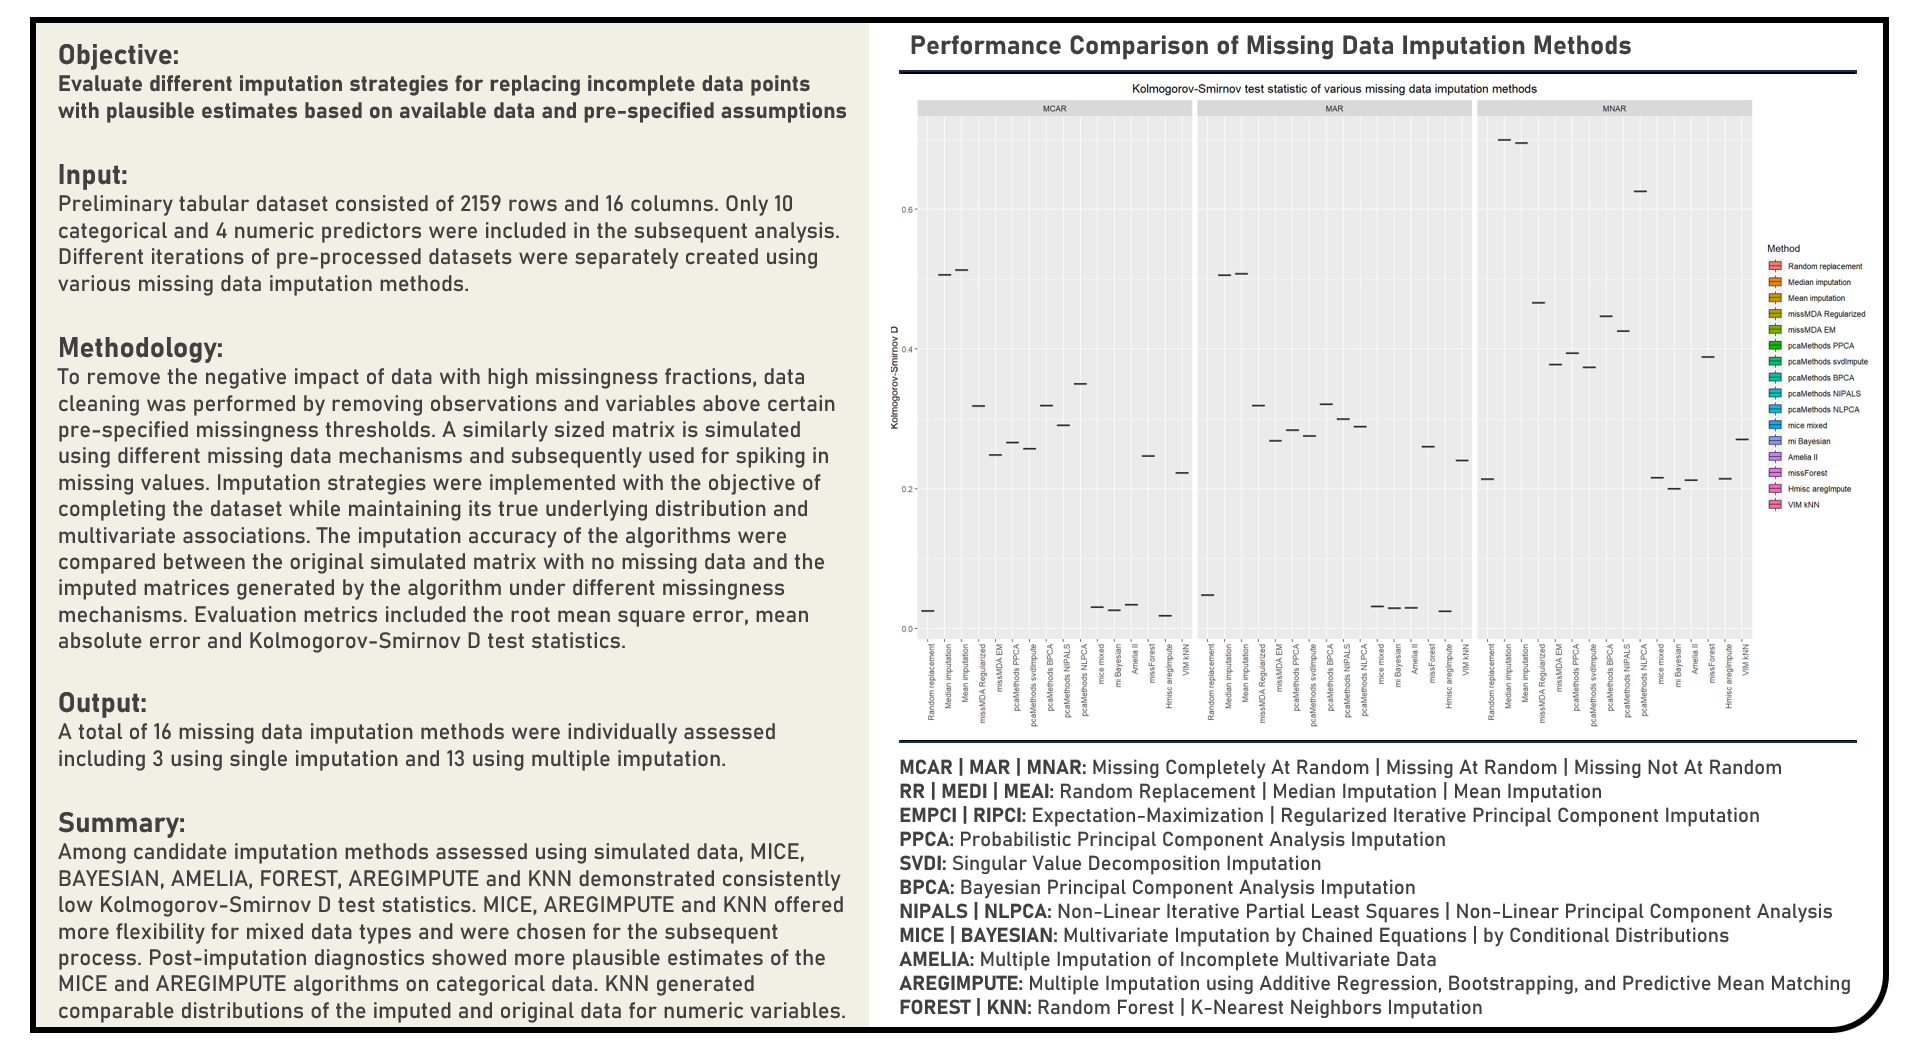
Data Preprocessing : Missing Data Pattern Analysis, Imputation Method Evaluation and Post-Imputation Diagnostics
This project explores various analysis and imputation procedures for incomplete data. Missing data patterns were visualized using matrix, cluster and correlation plots, with the missing data mechanism evaluated using a Regression-Based Test. Methods applied in the analysis to replace missing data points with substituted values included Random Replacement, Median Imputation, Mean Imputation, Mutivariate Data Analysis Imputation (Regularized, Expectation-Maximization), Principal Component Analysis Imputation (Probabilistic, Bayesian, Support Vector Machine-Based, Non-Linear Iterative Partial Least Squares, Non-Linear Principal Component Analysis), Multivariate Imputation by Chained Equations, Bayesian Multiple Imputation, Expectation-Maximization with Bootstrapping, Random Forest Imputation, Multiple Imputation Using Additive Regression, Bootstrapping and Predictive Mean Matching and K-Nearest Neighbors Imputation. Performance of the missing data imputation methods was evaluated using the Processing Time, Root Mean Squared Error, Mean Absolute Error and Kolmogorov-Smirnov Test Statistic metrics. Post-imputation diagnostics was performed to assess the plausibility of the substituted values in comparison to the complete data.
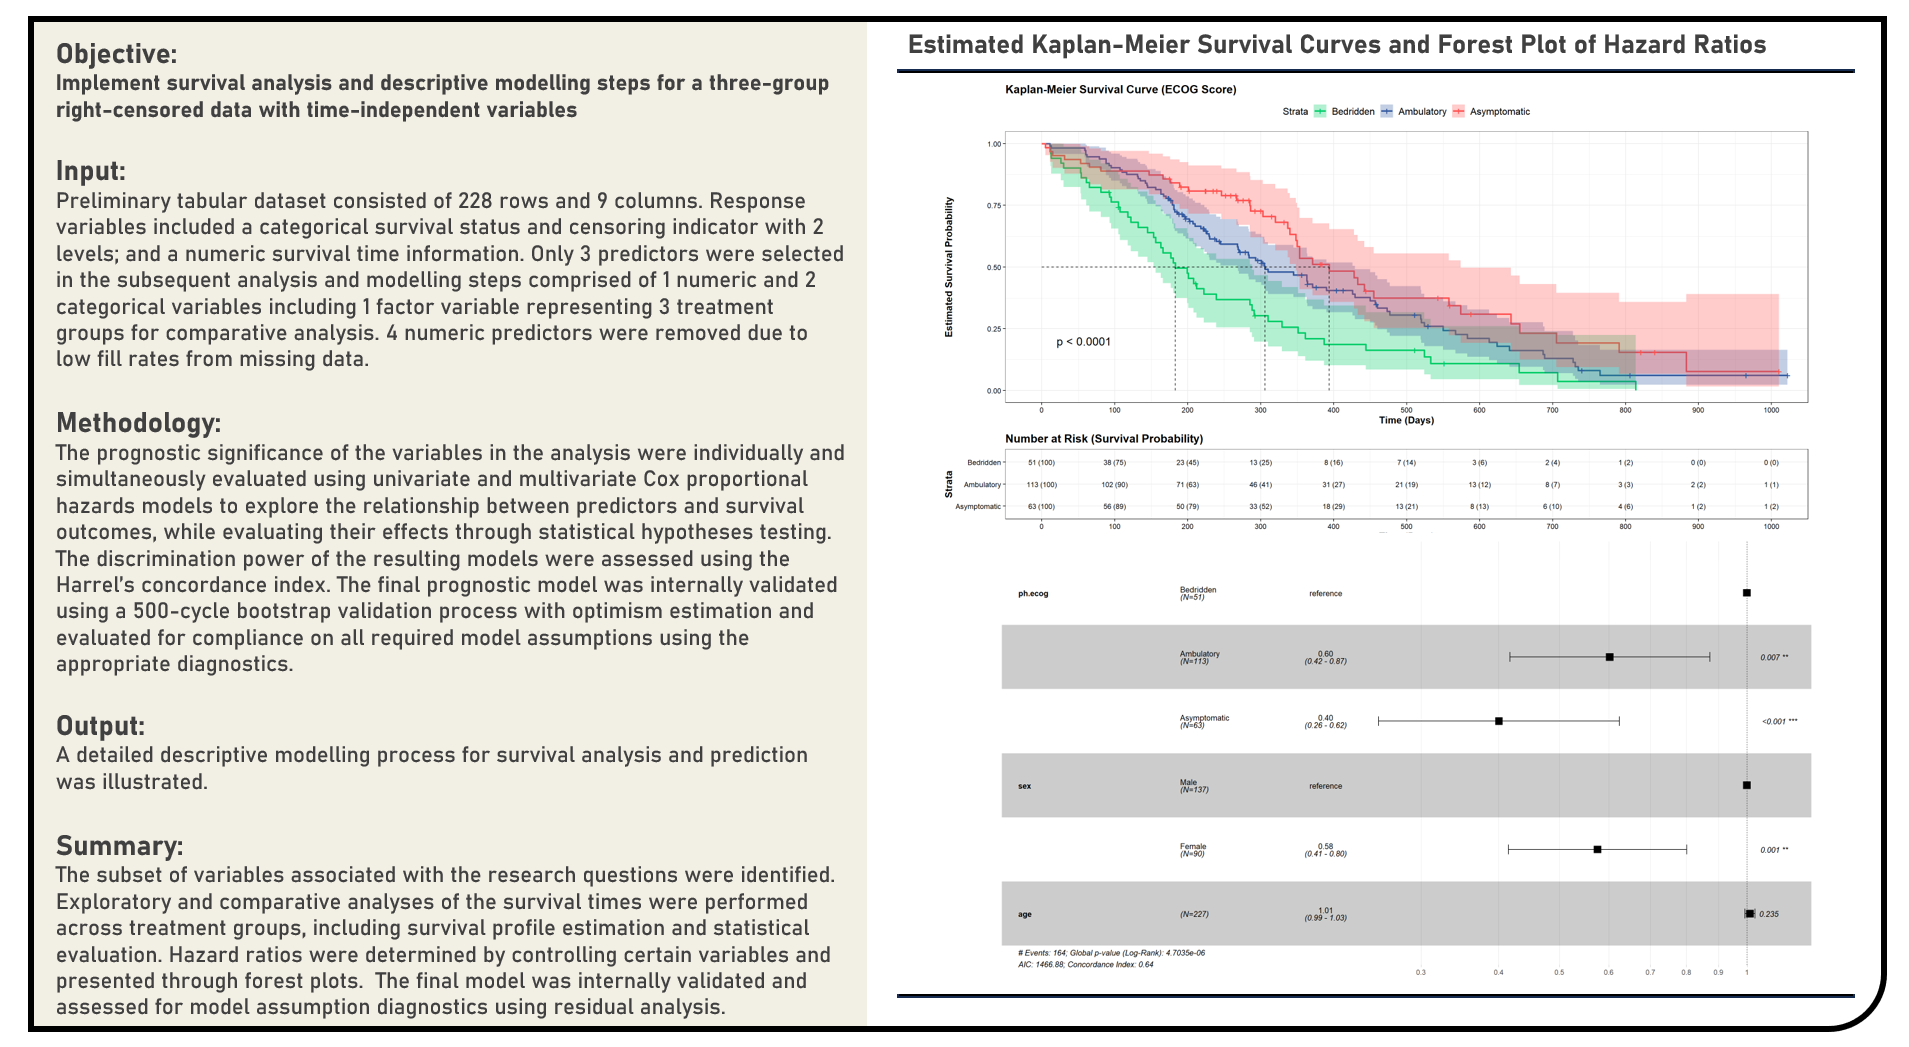
Supervised Learning : Survival Analysis and Descriptive Modelling for a Three-Group Right-Censored Data with Time-Independent Variables Using Cox Proportional Hazards Model
This project implements the survival analysis and descriptive modelling steps for a three-group right-censored data with time-independent variables using the Cox Proportional Hazards Model. The Kaplan-Meier Survival Curves and Log-Rank Test were applied during the differential analysis of the survival data between groups. All predictors’ prognostic significance were individually and simultaneously evaluated using Univariate and Multivariate Cox Proportional Hazards Models, respectively. The discrimination power of the resulting models were assessed using the Harrel’s Concordance Index. The final prognostic model was internally validated using Bootstrap Validation with Optimism Estimation and evaluated for compliance on all required model assumptions using the appropriate diagnostics.
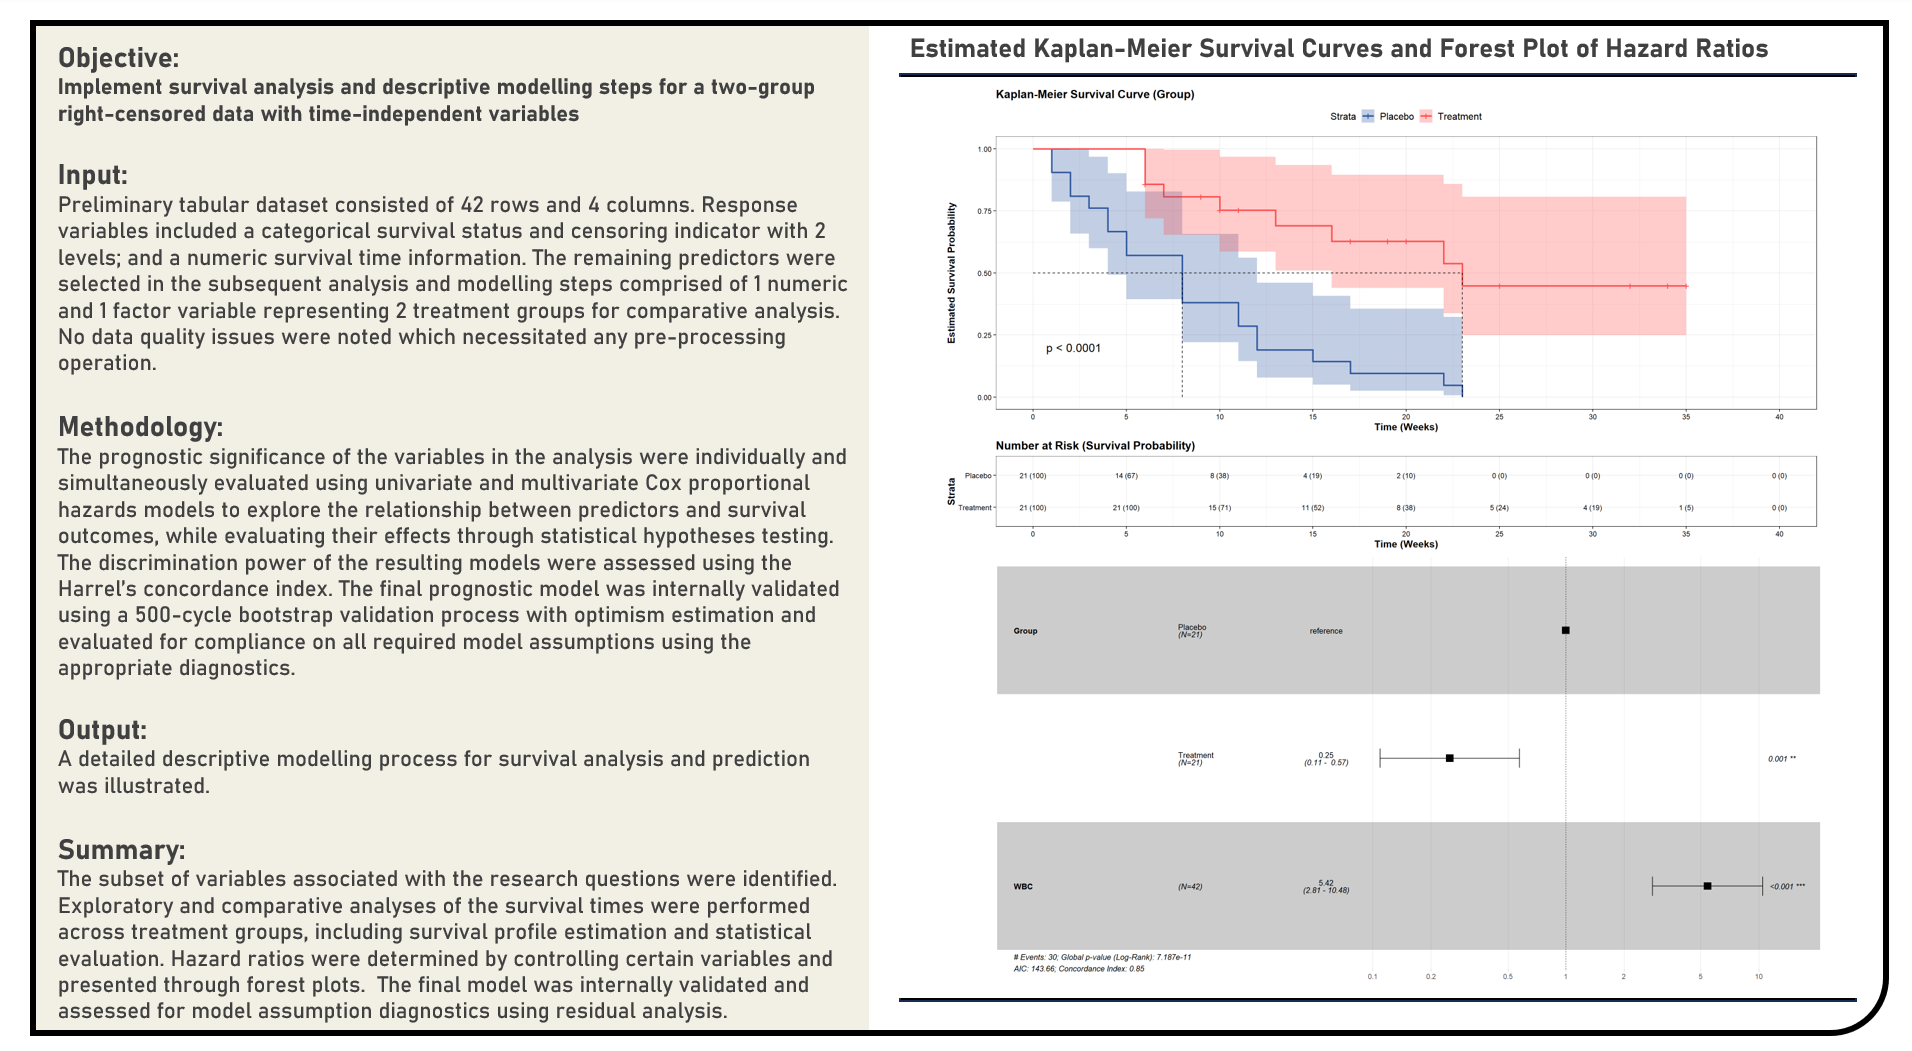
Supervised Learning : Survival Analysis and Descriptive Modelling for a Two-Group Right-Censored Data with Time-Independent Variables Using Cox Proportional Hazards Model
This project implements the survival analysis and descriptive modelling steps for a two-group right-censored data with time-independent variables using the Cox Proportional Hazards Model. The Kaplan-Meier Survival Curves and Log-Rank Test were applied during the differential analysis of the survival data between groups. All predictors’ prognostic significance were individually and simultaneously evaluated using Univariate and Multivariate Cox Proportional Hazards Models, respectively. The discrimination power of the resulting models were assessed using the Harrel’s Concordance Index. The final prognostic model was internally validated using Bootstrap Validation with Optimism Estimation and evaluated for compliance on all required model assumptions using the appropriate diagnostics.
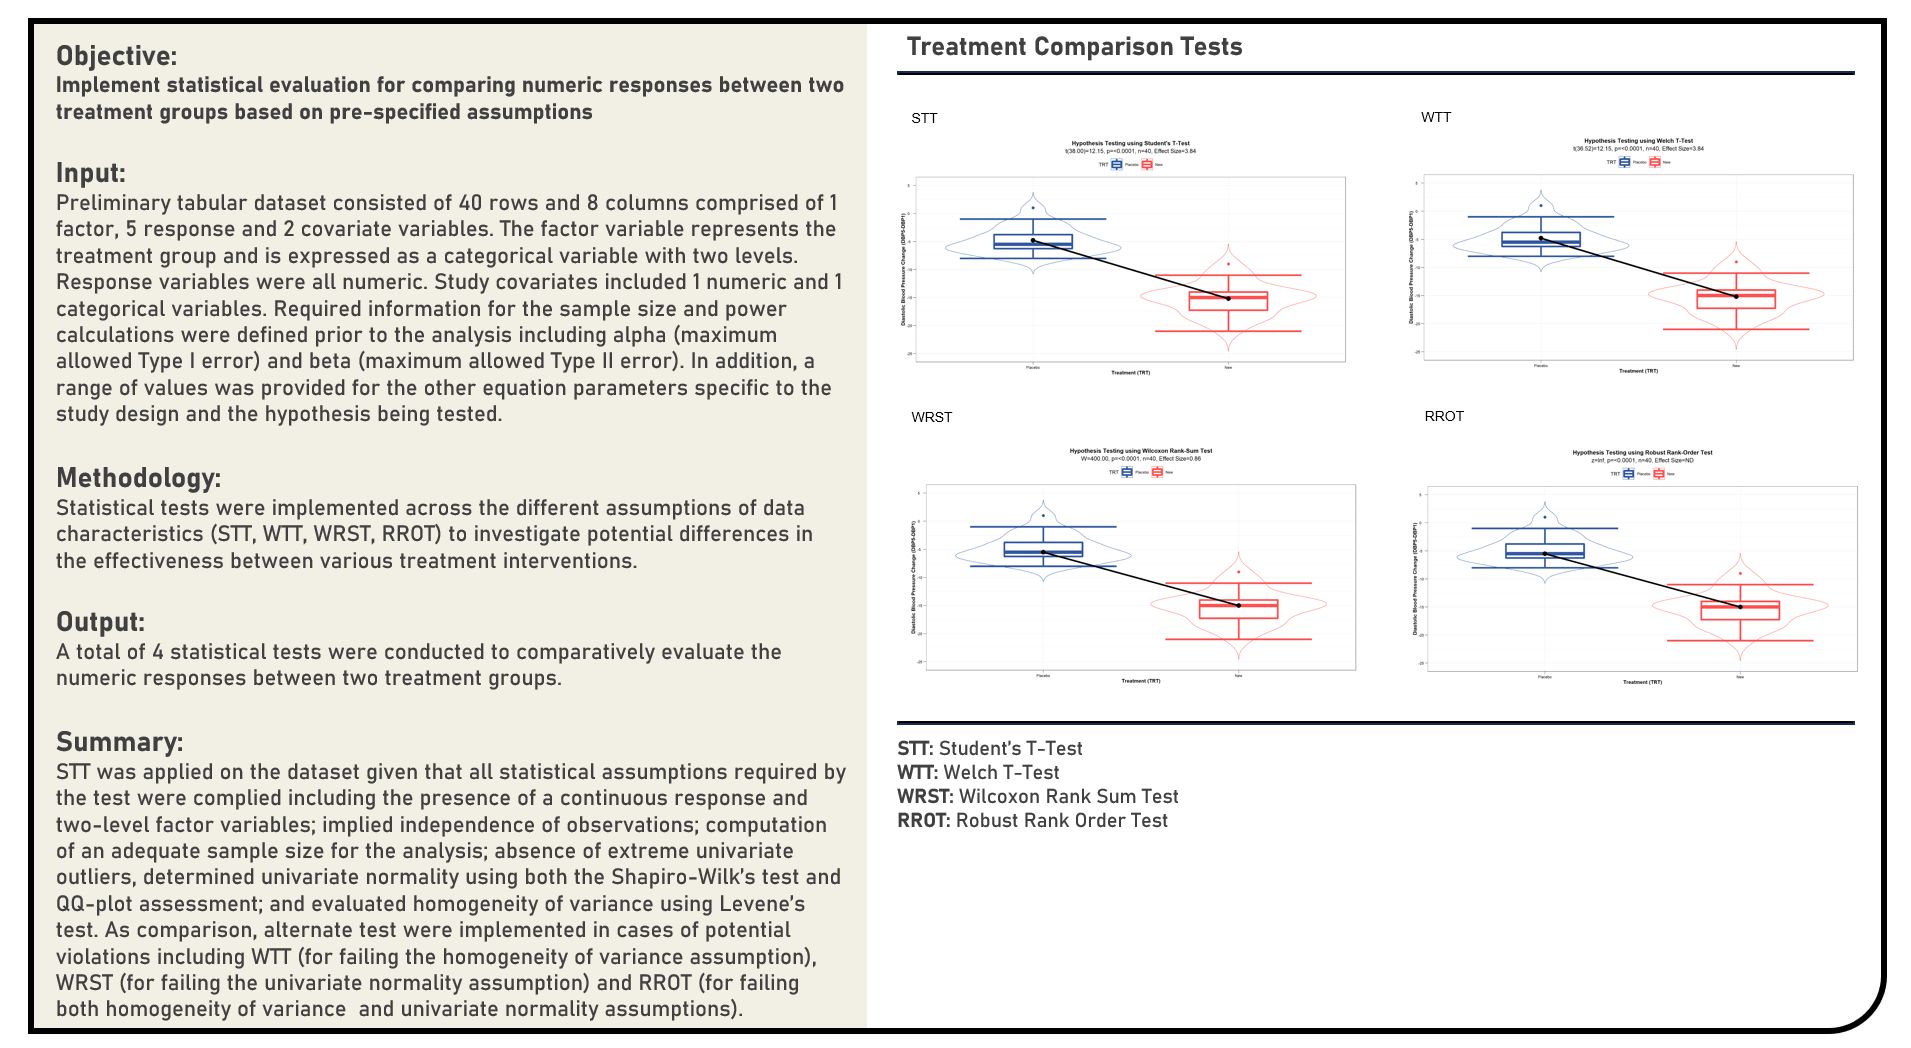
Statistical Evaluation : Treatment Comparison Tests Between a Single Two-Level Factor Variable and a Single Numeric Response Variable
This project explores the various methods in comparatively evaluating the numeric response data between two treatment groups in a clinical trial. Statistical tests applied in the analysis included the Student’s T-Test, Welch T-Test, Wilcoxon Rank-Sum Test and Robust Rank-Order Test.
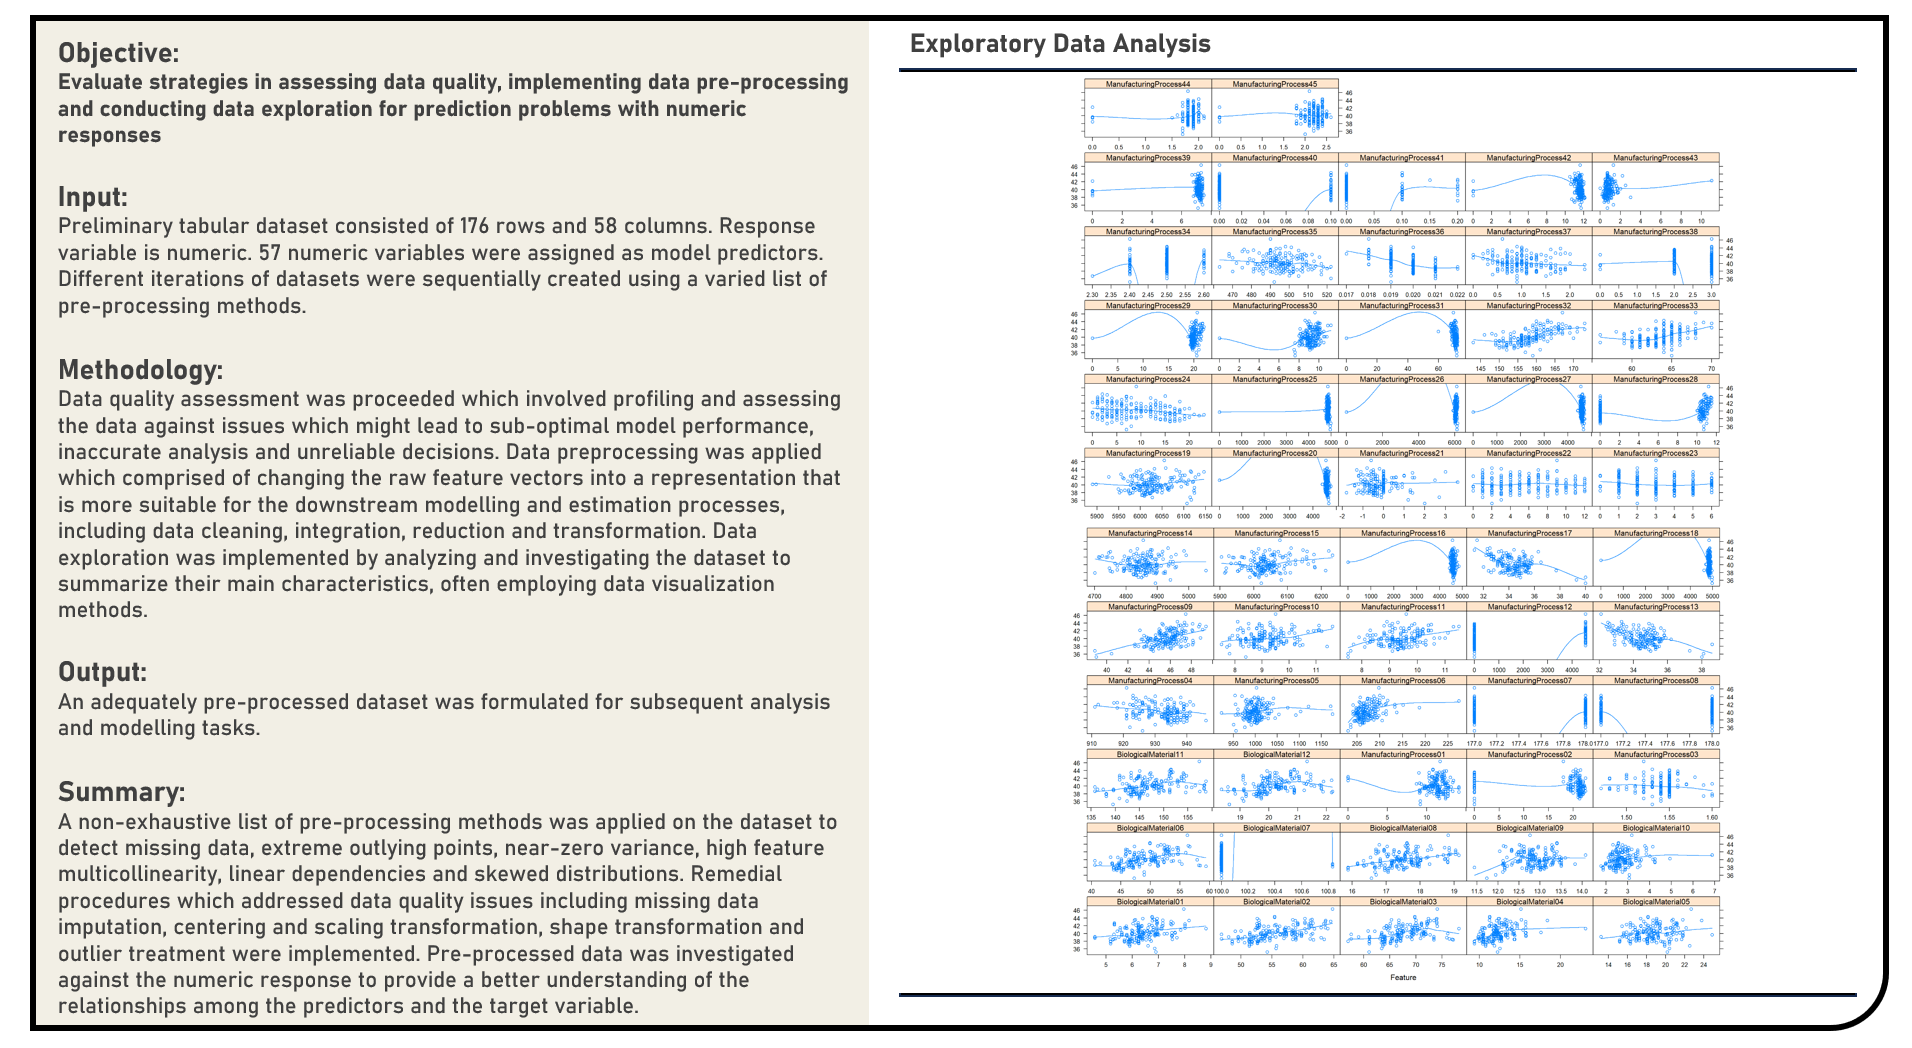
Data Preprocessing : Data Quality Assessment, Preprocessing and Exploration for a Regression Modelling Problem
This project explores the various methods in assessing data quality, implementing data preprocessing and conducting exploratory analysis for prediction problems with numeric responses. A non-exhaustive list of methods to detect missing data, extreme outlying points, near-zero variance, multicollinearity, linear dependencies and skewed distributions were evaluated. Remedial procedures on addressing data quality issues including missing data imputation, centering and scaling transformation, shape transformation and outlier treatment were similarly considered, as applicable.
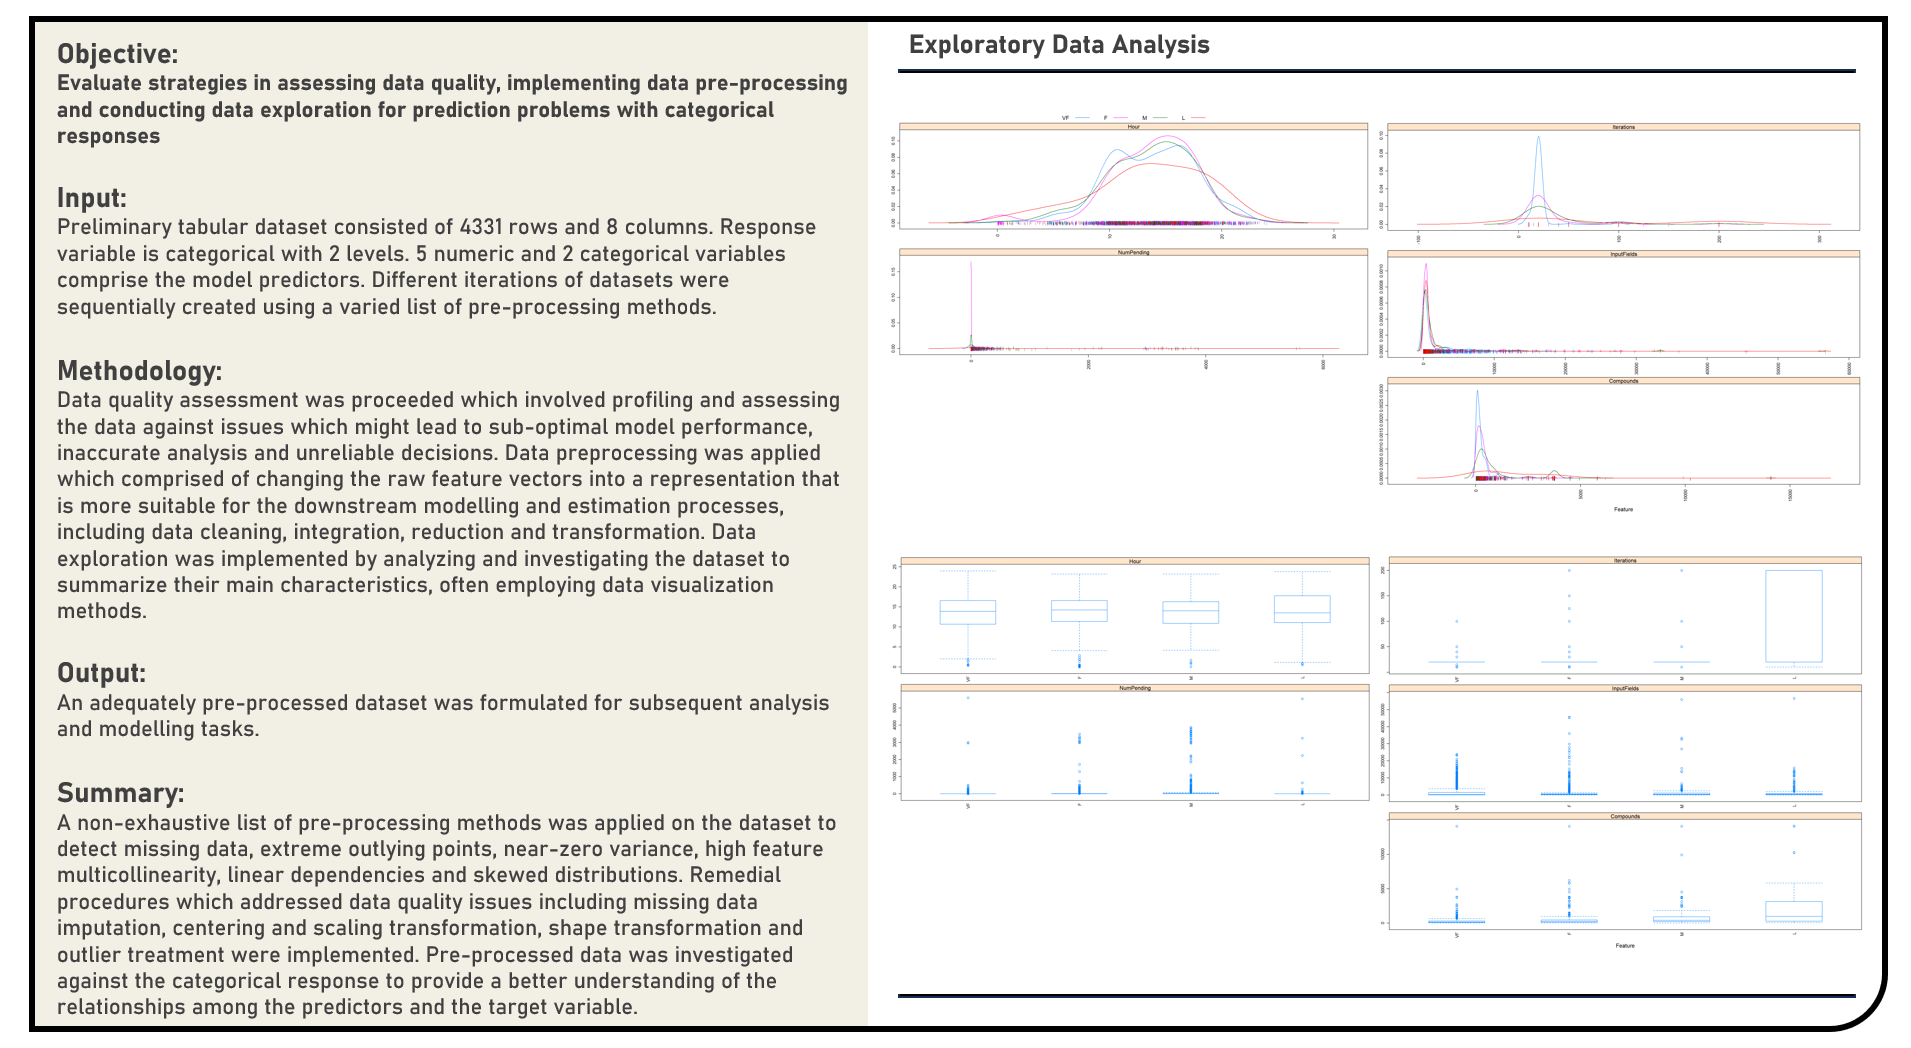
Data Preprocessing : Data Quality Assessment, Preprocessing and Exploration for a Classification Modelling Problem
This project explores the various methods in assessing data quality, implementing data preprocessing and conducting exploratory analysis for prediction problems with categorical responses. A non-exhaustive list of methods to detect missing data, extreme outlying points, near-zero variance, multicollinearity, linear dependencies and skewed distributions were evaluated. Remedial procedures on addressing data quality issues including missing data imputation, centering and scaling transformation, shape transformation and outlier treatment were similarly considered, as applicable.
Visual Analytics Projects
Data Visualization : Dashboard Development with Slice-and-Dice Exploration Features
This project enables the exploratory and comparative analyses of business indices across product categories and market locations using the Superstore Dataset. Visualization techniques applied in the formulated dashboard included honeycomb map charts to investigate for geographic clustering between high- and low-performing locations; sparkline charts to study the general trend of the business metrics over time; and bar charts to obtain perspectives on the performance across the various business components. Filtering features applied included a subset analysis based on regions and states.

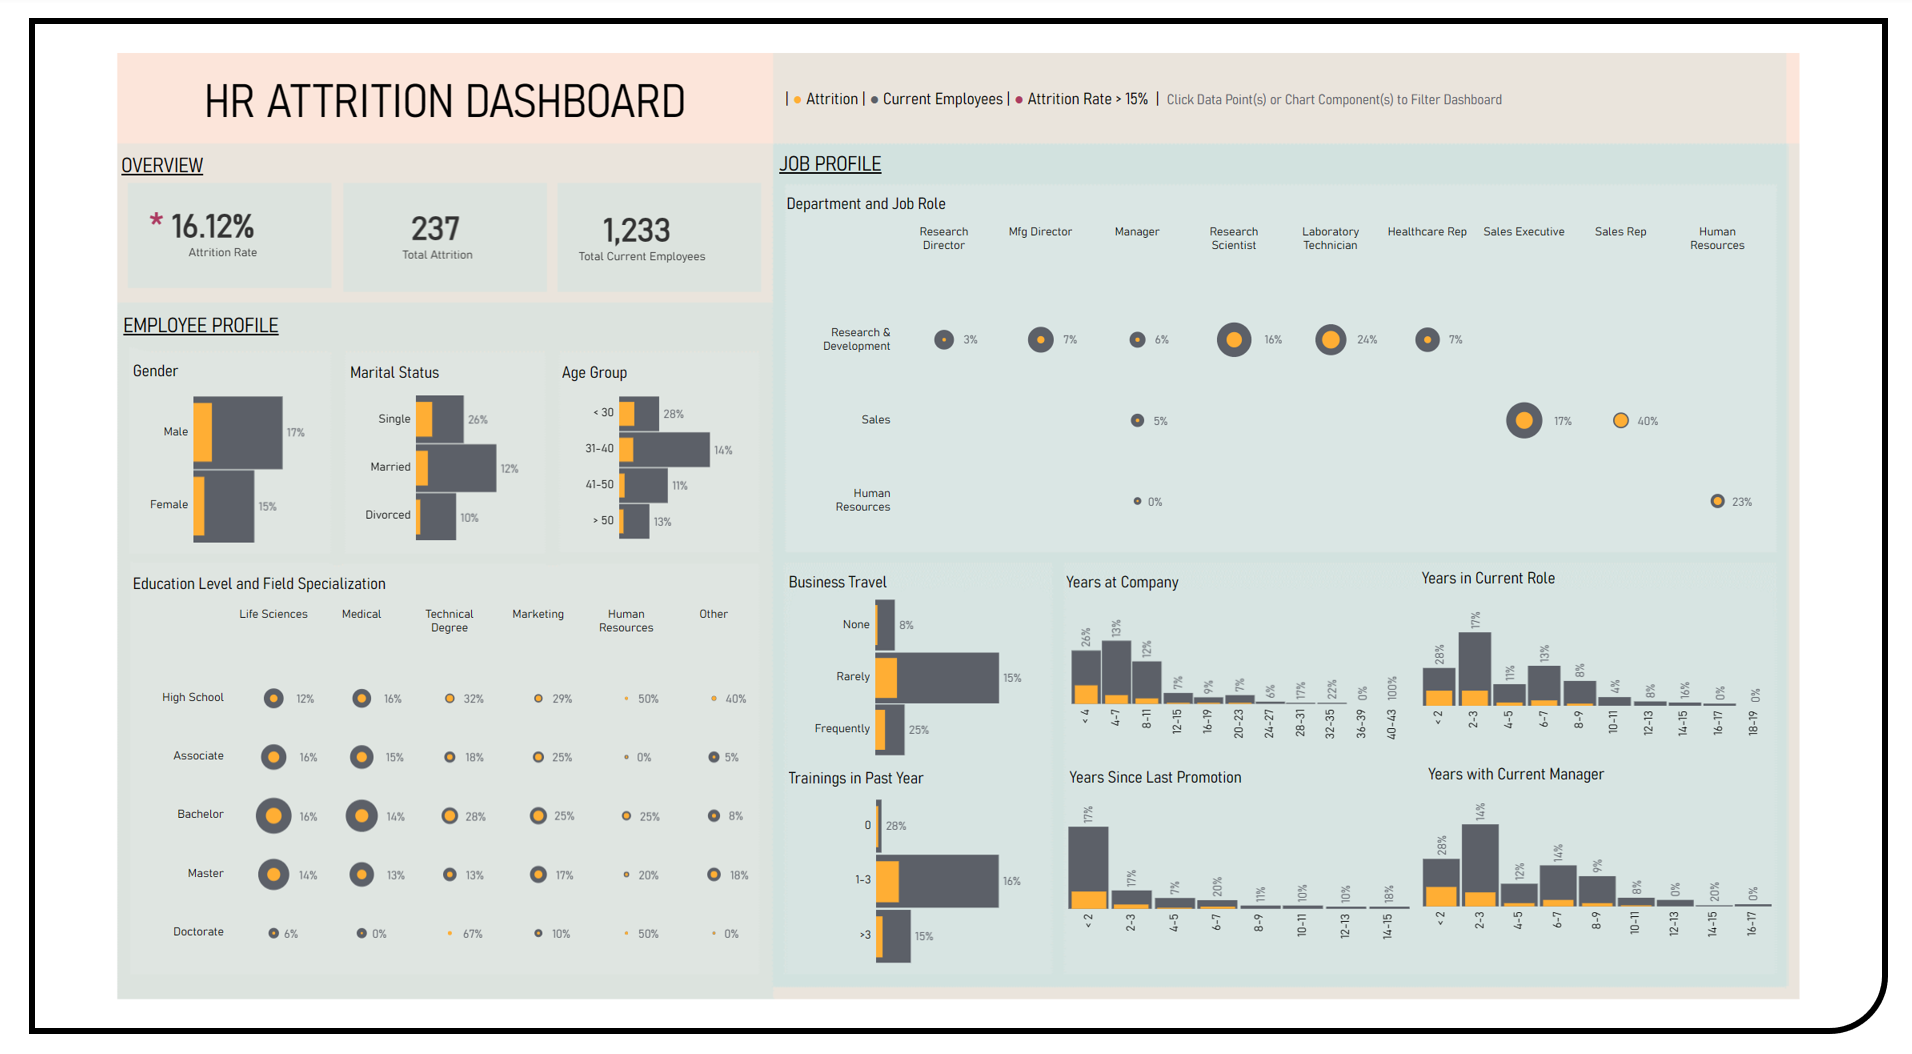
Data Visualization : Dashboard Development with Dynamic Filtering Features
This project enables the exploratory and comparative analyses of attrition rates across employee and job profile categories using the Kaggle IBM HR Dataset. Visualization techniques applied in the formulated dashboard included bar and figure charts to investigate the proportions of employees who have left the company in reference to those who stayed. A dynamic filtering feature was applied which allows for the simultaneous subset analyses across all dashboard data components including gender, marital status, age group, education level, field specialization, department, job role, business travel, training, years at company, years in current role, years since last promotion and years with current manager.
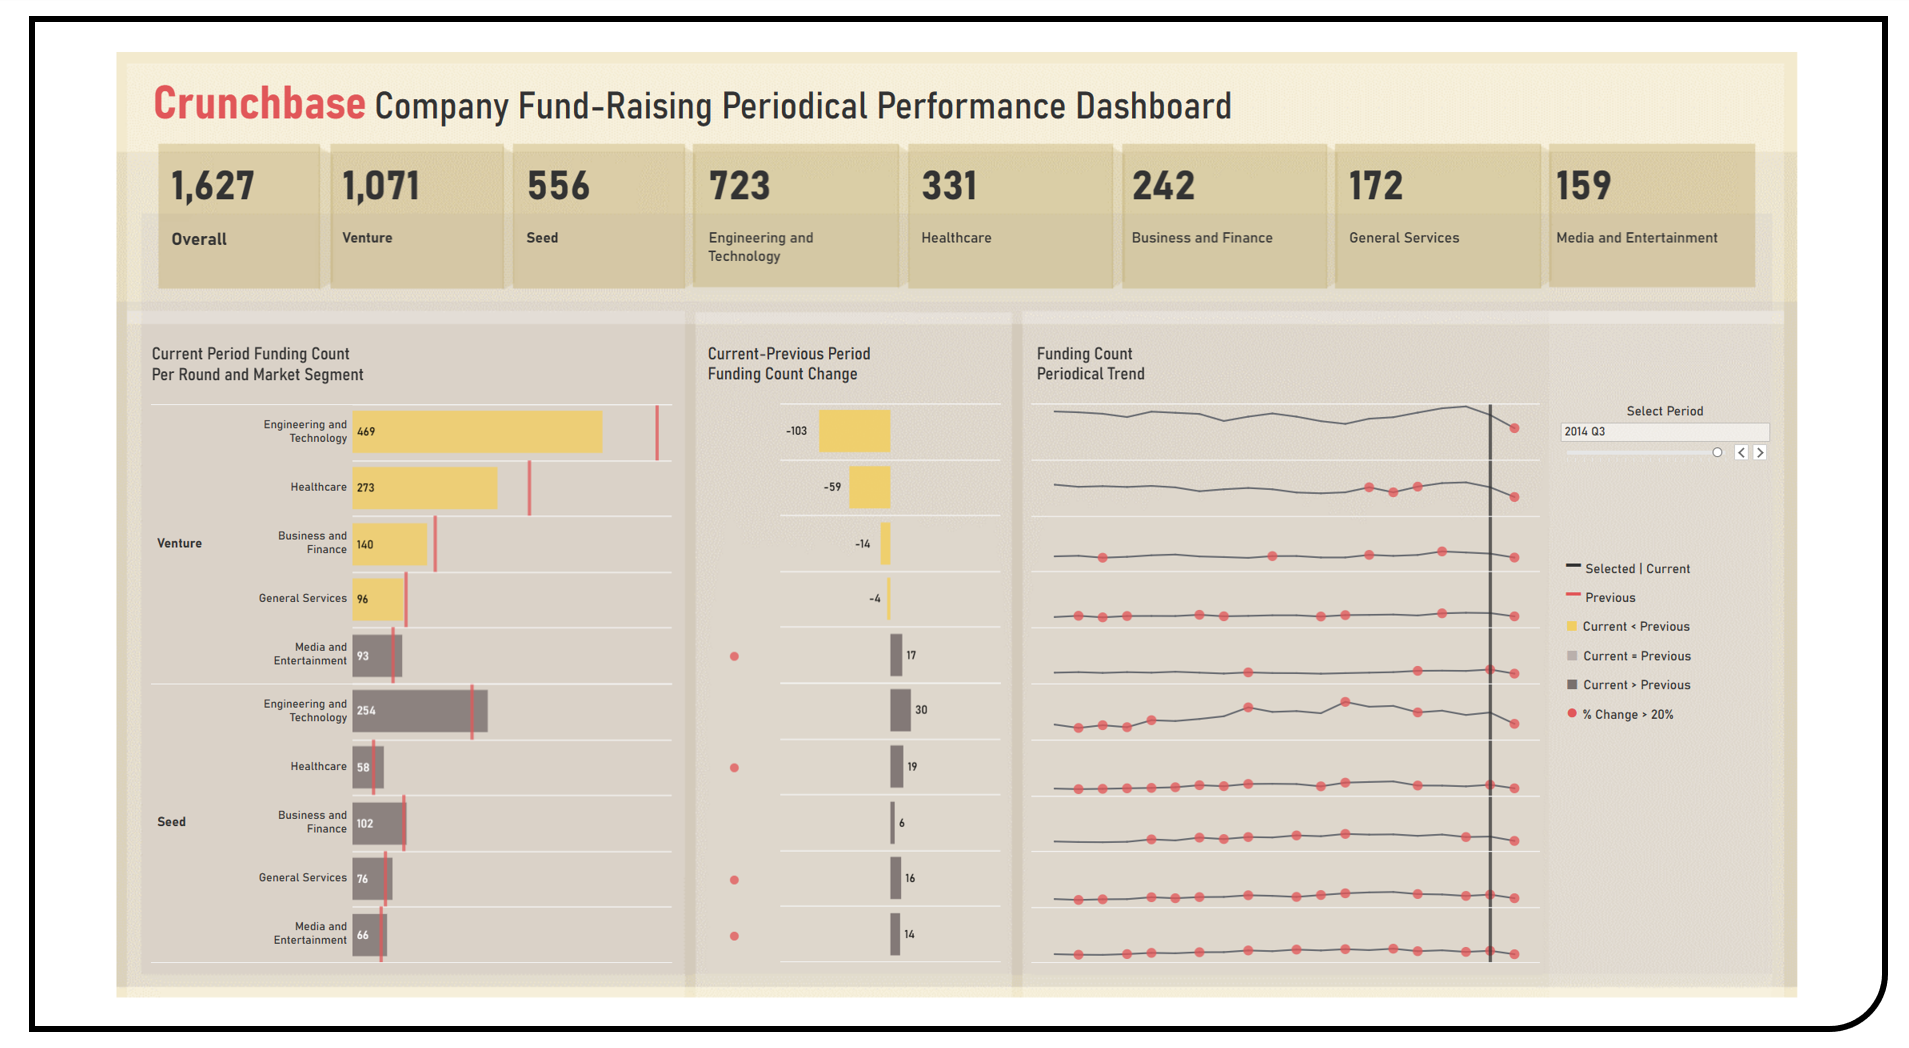
Data Visualization : Dashboard Development with Longitudinal Change Tracking Features
This project enables the exploratory and comparative analyses of company fund-raising periodical performance across round types and market segments using the Tableau Public Crunchbase Dataset. Visualization techniques applied in the formulated dashboard included bar charts to benchmark the number of fundings of the current period as compared to the previous period. Sparkline charts were used to display the funding count trend over the entire time range. Bar charts and markers were utilized to highlight significant changes between adjacent periods. A longitudinal change tracking feature was applied using a slider filter which allows for the periodical subset analyses across all dashboard components.
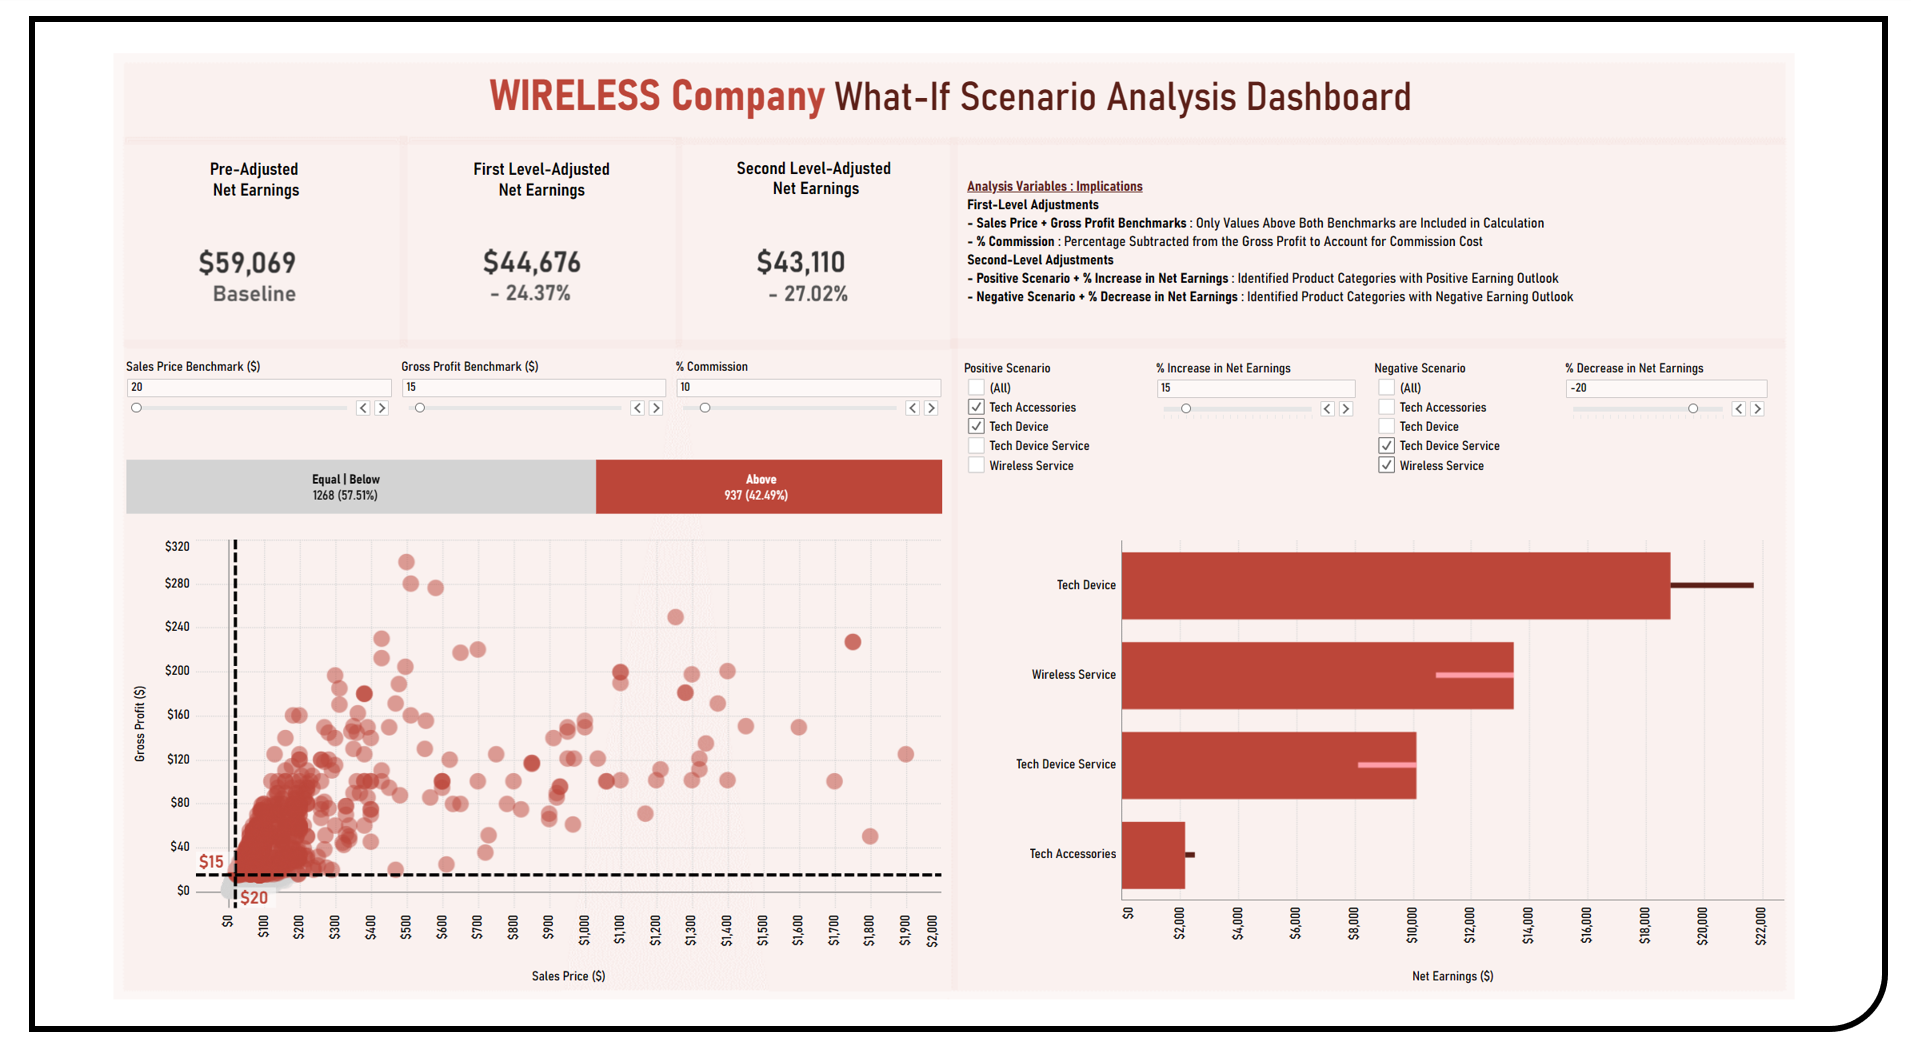
Data Visualization : Dashboard Development with What-If Scenario Analysis Features
This project enables the exploratory what-if scenario planning analyses of various business factors and conditions collectively influencing net earnings using the Kaggle Wireless Company Dataset. Visualization techniques applied in the formulated dashboard included a scatterplot to show the distribution of sales prices and gross profits prior to benchmarking actions. A bar chart was used to dynamically present the count and distribution of items based on the selected benchmark cut-offs. Gantt bar charts were utilized to compare the reference and adjusted net earning levels given the positive or negative business conditions identified. All analysis variables can be adjusted using slider and list filters which allow for the dynamic exploration of different scenarios across all dashboard components.
Data Visualization : Dashboard Development with Period-To-Date Performance Tracking Features
This project enables the period-to-date performance tracking and analysis of various business indices using the Kaggle Sports Store Company Dataset. Visualization techniques applied in the formulated dashboard included line charts to demonstrate the running weekly totals of sales, profit and quantity measures for the latest quarter as compared to benchmarked periods including the previous quarter of the same year, and the same quarter from the previous year. Bar charts were used to present the consolidated quarterly indices. Additional customer and product attributes were included as drop-down list filters which allow for the periodical subset analyses across all dashboard components.

Scientific Research Papers
Cancer Communications : Genomic Imprinting Biomarkers for Cervical Cancer Risk Stratification
This paper is a collaborative study on formulating a cervical malignancy risk prediction model using epigenetic imprinting biomarkers. Statistical methods were applied accordingly during differential analysis; gene screening study; and diagnostic classification model building, optimization and validation. The area under the receiver operating characteristics curve (AUROC) metric was used to measure the discrimination power of the candidate predictors, with the classification performance of the candidate models evaluated using the sensitivity, specificity, positive predictive value (PPV) and negative predictive value (NPV) metrics. The final prediction model was internally validated using a 500-cycle optimism-adjusted bootstrap and externally validated using an independent cohort.
Journal of Clinical Oncology : High Diagnostic Accuracy of Epigenetic Imprinting Biomarkers in Thyroid Nodules
This paper is a collaborative study on formulating a thyroid cancer prediction model using epigenetic imprinting biomarkers. Statistical methods were applied accordingly during differential analysis; gene screening study; and diagnostic grading model building, optimization and validation. The area under the receiver operating characteristics curve (AUROC) metric was used to measure the discrimination power of the candidate predictors, with the classification performance of the candidate models evaluated using the sensitivity, specificity, positive predictive value (PPV) and negative predictive value (NPV) metrics. The final prediction model was internally validated using a 500-cycle optimism-adjusted bootstrap and externally validated using an independent cohort.
Clinical Epigenetics : Epigenetic Imprinting Alterations as Effective Diagnostic Biomarkers for Early-Stage Lung Cancer and Small Pulmonary Nodules
This paper is a collaborative study on formulating a lung cancer prediction model using epigenetic imprinting biomarkers. Statistical methods were applied accordingly during differential analysis; gene screening study; and diagnostic grading model building, optimization and validation. The area under the receiver operating characteristics curve (AUROC) metric was used to measure the discrimination power of the candidate predictors, with the classification performance of the candidate models evaluated using the sensitivity and specificity metrics. The final prediction model was externally validated using an independent cohort.
Clinical Epigenetics : Novel Visualized Quantitative Epigenetic Imprinted Gene Biomarkers Diagnose the Malignancy of Ten Cancer Types
This paper is a collaborative study on malignancy differentiation for bladder, colorectal, gastric, pancreatic, skin, breast, esophagus, lung, prostate and thyoid tumors using epigenetic imprinting biomarkers. Statistical methods were applied accordingly during differential analysis; gene screening study; and diagnostic classification model building. The area under the receiver operating characteristics curve (AUROC) metric was used to measure the discrimination power of the candidate predictors, with the classification performance of the candidate models evaluated using the sensitivity and specificity metrics. The preliminary models presented were exploratory in nature and were not externally validated using an independent cohort.
Ultrasound in Medicine and Biology : New Thyroid Imaging Reporting and Data System (TIRADS) Based on Ultrasonography Features for Follicular Thyroid Neoplasms: A Multicenter Study
This paper is a multicenter study on formulating a thyroid risk stratification system specifically for follicular thyroid neoplasms (FTNs), including adenomas and carcinomas, using ultrasonographic features. Statistical methods were applied during feature analysis, model development using logistic regression, and diagnostic classification optimization and validation. The area under the receiver operating characteristic curve (AUROC) metric was used to assess diagnostic discrimination, while classification performance was compared against four existing risk stratification systems using sensitivity, specificity, and unnecessary fine needle aspiration (FNA) rates. The final FTN-TIRADS model was internally tested and externally validated in an independent cohort, demonstrating superior diagnostic performance and a significantly lower unnecessary FNA rate compared to current guidelines.
Conference Abstracts
- Journal of Thoracic Oncology : Advancing Malignancy Risk Stratification for Early-Stage Cancers in Lung Nodules by Combined Imaging and Electrical Impedance Analysis
- Journal of Thoracic Oncology : Intronic Noncoding RNA Expression of DCN is Related to Cancer-Associated Fibroblasts and NSCLC Patients’ Prognosis
- Journal of Thoracic Oncology : Epigenetic Imprinted Genes as Biomarkers for the Proactive Detection and Accurate Presurgical Diagnosis of Small Lung Nodules
- Journal of Clinical Oncology : Effect of Epigenetic Imprinting Biomarkers in Urine Exfoliated Cells (UEC) on the Diagnostic Accuracy of Low-Grade Bladder Cancer
- Journal of Clinical Oncology : Epigenetic Imprinted Gene Biomarkers Significantly Improve the Accuracy of Presurgical Bronchoscopy Diagnosis of Lung Cancer
- American Journal of Respiratory and Critical Care Medicine : Quantitative Chromogenic Imprinted Gene In Situ Hybridization (QCIGISH) Technique Could Diagnose Lung Cancer Accurately
Page template forked from evanca


